
PSN Client Service Team will provide:
· On-line Web Training
· Telephone Support
If you need training, have questions, comments or suggestions concerning our software; please contact our PSN Client Service Team:
Client Service Support:
Phone: 800-789-5323
E-Mail: clientservices@informais.com
A Direct Path to Separate Account Data
PSN Enterprise, a product developed by Informa Investment Solutions, is the most comprehensive and easy to use investment manager database available. PSN Enterprise is a web-based application that will be the keystone in building your separate account business.
PSN Enterprise is powered by the PSN investment manager database. Since 1984, PSN has been recognized as the premier investment manager database. We earned this reputation because of PSN’s wealth of accurate data, flexibility, exclusive functions and exceptional service.
Data Integrity
Informa Investment Solutions serves as an objective, third-party supplier of information. We maintain no affiliations with any of the investment managers we track, and pride ourselves in providing purely impartial data. And all PSN information is primary data. We solicit the information directly from the source, which makes the data more consistent and reliable.
Data Breadth
PSN boasts a global database of more than 1,300 investment managers, representing more than 5,000 US, global and international investment products. This expansive database assures you a thorough representation of the investment management arena.
Data Depth
When you use PSN data in PSN Enterprise, you get immediate access to high-quality, detailed information on each firm capturing over 1,000 data points.
PSN Enterprise's investment manager profiles provide in-depth information on each manager and their product offerings, including assets, fee structure, composite holdings, and historical returns and statistics. In addition to quantitative data, PSN Enterprise also includes objective, narrative data. Categories, such as investment philosophy, portfolio construction biographies of senior investment professionals, enhance your analysis with valuable insight.
The Manager Search Made Easy
PSN Enterprise offers you unmatched power to manipulate and evaluate the wealth of information in the PSN database. Match your investment objectives with the right investment manager in minutes. All the information you need is at your fingertips.
Built-In Investment Formulas
PSN Enterprise gives you the ability to measure performance, conduct detailed statistical analysis and assess risk. The system has built-in formulas for the sophisticated calculations that investment professionals require. From beta and information ratio, to downside risk and upside uncertainty, PSN Enterprise executes the calculations you need. You can select your own date ranges and benchmarks in your analysis. Or, you can use over 2 million pre-generated statistical calculations for quick performance comparisons.
Universe Comparisons
PSN Enterprise keeps it simple. We give you all the functions you need without slowing you down with too many choices to make and too many buttons to click. Either choose from our convenient pre-saved universes or screen on key data fields to create your own custom peer groups. You can save your favorite universes for later retrieval. What was once an arduous process can now be accomplished with speed, versatility and ease.
Self-Entered Module
Include proprietary information in your analysis by using the Self-Entered Module. Enter monthly or quarterly returns on any individual account, mutual fund, hedge fund, composite, index, etc. Once entered, you may include these portfolios in any of your PSN Enterprise evaluations.
Blended Portfolio Analysis
Combine the returns of indices, investment products, or your Self-Entered data with PSN Enterprise’s blended portfolio analysis. You can even rebalance or change allocation over time. Create one or more scenarios and compare them against each other to arrive at a suitable recommendation. Once created, blends can be saved and automatically updated for future use in a new or existing report.
Style Analysis
Determine a product’s return-based style as compared to standard benchmarks. The Style Analyzer allows you to look at a manager’s style exposure and drift compared to other manager with the same investment style. Historical, rolling time period and current style analysis information can be displayed in graphical or tabular format. Style analysis is available for all major asset classes.
Asset Allocation
Before choosing allocation percentages for your blended portfolio, inspect an efficient frontier that contains a list of possible optimal portfolio combinations. Let PSN Enterprise show you the optimal solution based on your risk and return preferences. Options include manager and asset class optimization.
Report Writer
Define report columns using any data field within PSN Enterprise and arrange the information as you see fit. Your reports will be thorough and easy to understand. View it, print it or download it to an Excel spreadsheet.
Graphs and Reports
Strengthen your comparative analysis with graphs and reports. Choose from PSN Enterprise's wide selection of options and produce professional-quality output, without utilizing different software. Customize your output by easily changing fonts, colors, styles, observations, benchmarks, date ranges and statistics. You can even import your own logo.
Modify graphs and reports for one-time use, or save them as custom templates which can be updated with new data. Graphs and reports can be saved within PSN Enterprise or exported to other Microsoft Windows software.
Report Designer
Report Designer will allow you to design your own report templates by combining data, graphs, text, and images. Using text blocks and graphics from our library or creating your own, you can do a side-by-side comparison of two or more managers or products, and the choice of content and placement is completely customizable. Features include drag and drop, resizing and menus to customize both individual sections of the report, or to set parameters for the entire presentation. Report templates created by the report designer can be reused and modified to meet your changing needs.
Presentation
PSN Enterprise enables you to combine multiple graph and report templates to create presentation for different clients or prospects. Maintain consistency and save time preparing for your next meeting. The instant proposal function compiles reports, graphs, market commentary, compliance information, proprietary fact-sheets, and third party output to create a complete business or client presentation. Presentations can be saved for individual use or shared between specified users.
Batch Production
Each report template in PSN Enterprise contains its own intelligence by storing the default criteria of each report. Our batch production system enables you to group multiple report templates into a single presentation. Viewing or printing a large presentation is now just a few keystrokes away.
If performance monitoring or batch reporting production is your requirement, PSN Enterprise gives you the power and ease to batch produce countless presentations quickly and efficiently.
Custom Solutions Too
Every client is different. We, at Informa Investment Solutions, pride ourselves in our ability to create custom solutions for our client’s unique needs. Add extra data fields or develop your own reports with help from our team of skilled developers. PSN Enterprise is flexible enough to handle any requirement. There is no denying that PSN is the most complete data source for separate account information. But maybe separate account information is not all your need. We made PSN Enterprise so flexible that it can handle multiple data sources, such as mutual funds, hedge funds and other investment information.
Training & Support
We provide unlimited product training and technical support. Once we get you started, we don't disappear. Our experienced support team is available to offer assistance, Monday through Friday, 8:30 AM to 6:00 PM (ET). Help is always just a phone call away.
Experience the Best
For over 25 years, Informa Investment Solutions has been providing consultants, brokers, investment managers, and plan sponsors with separate account information. Extensive data, user-friendly application, and easy deployment make PSN Enterprise the ideal separate account solution. Informa Investment Solutions has the experience and knowledge to build your separate account business.
This application has the following requirements:
Internet Explore 8.0
Google Chrome
Firefox
Mac
Informa Investment Solutions has granted the user access to the PSN Enterprise system and data based on one user connected to a functional email address. This is a web-based application it is not contingent on user location. As long as there is an Internet connection, the user will be able to gain access to PSN Enterprise using the same user name (email address) and password.
At the time of login, we will authenticate the user using information provided to us by the user’s organization. ONLY AUTHORIZED USERS WILL BE ALLOWED TO ENTER INTO THE SYSTEM.
Other users who are connected to the Internet may not use PSN Enterprise unless they are also valid users of PSN Enterprise, each with their own user name (email address) and password. Because the security is imbedded in the software, please contact us regarding new users so that we can activate each new user and give them their own access to PSN Enterprise.
To add new users, please contact your account manager for additional services.
If you need training, have questions, comments or suggestions concerning our software; please contact the client services by using one of the following methods:
E-mail: clientservices@informais.com Subject: PSN
Phone:
(775) 588-0654 | (800) 789-5323
Mail:
Informa Investment Solutions
Client Service Department
4 Westchester Park Drive
White Plains, NY 10604
Training sessions and support are available at the user’s convenience. We provide one on one as well as group training both on-site, off-site or by telephone depending on the client’s request. Once we get you started, we won't disappear. We stay behind the scenes to offer you help when it's needed. Our experienced support team is available for questions, Monday through Friday, 8:00 AM to 5:00 PM (ET). Help is always just a phone call away.
Customization
We offer product training that is tailored to meet your specific needs. By applying the principles of the product directly to your work, the training is much more effective. We will walk through real-life work scenarios together to help you apply the Informa Investment Solutions product directly to your work. We also help customize product features to your specifications to help you save time in the future.
Tiered Training
We offer three different levels of training, ranging from beginner to expert.
v Start-Up Training ~ for new users or trainers
v Brush-Up Training ~ a review of the main product features and instruction for new features
v Master Training ~ for experienced users or trainers who want to use PSN to its full potential
Flexibility
We realize that your work schedule is challenging. That's why we offer considerable flexibility in our training sessions. We will conduct training for one person, or the entire team. And, we are willing to come to you, or we can hold the training in our offices in White Plains, New York. (30 Minutes north of New York City). Though we would rather get to know you in person, we also offer training by phone.
All client service calls are returned in one business day or less. Close to 100% of calls are answered immediately or in less than one hour. There is also a help system in our software for those who prefer to figure it out for themselves.
As a user of our system, you will be provided with an online user reference guide. The guide contains quick steps on how to perform certain functions within the system. Detailed definition on data and modules are just small parts of this helpful user reference guide. To keep users informed of the latest enhancement to the product they licensed, we created IIS Messenger, our own mass email system. IIS Messenger was developed by our own programming department as a client service tool and has evolved into an Informa Investment Solutions product offering.
Every year Informa Investment Solutions surveys our clients to find out what new enhancements they would like in the product they licensed. This is done through electronic survey, phone survey, individual face-to-face meetings, as well as client group meetings. After compiling the responses, we try to best accommodate our client’s wishes.
Our philosophy is quite simple. We created databases and applications to service the investment community so feedback from the investment community is vital. Thanks to our ongoing client communication effort and our open-door policy, many improvements to our manager information system are generated from actual client comments.
When it’s time to research investment managers, we at Informa Investment Solutions understand your need for the most accurate, complete and up-to-date information. We offer you just that. In September of 2006, the industry’s two most comprehensive investment manager databases, M-Search and PSN Data, were combined to form the much enhanced PSN database.
Consistently updating and validating the data from investment managers is key to maintaining the integrity of the database and has been our core competency for more than 20 years. No one else in the industry can make that claim.
Collecting the Data
Manager Neighborhood is Informa’s central data collection site for investment managers. Due to the deep penetration of PSN data into the market, participating managers understand and appreciate the importance of including their data in the database. Informa charges no fee to investment managers for participation, and managers have 24/7 online access to Manager Neighborhood to allow for data input whenever it’s convenient for them. To ensure the most-up-to-date information, managers must report on a regular basis in accordance with published deadlines.
Validating the Data
Because the quality and reliability of the data is as important as the quantity of information provided in the database, data completeness and accuracy are crucial. Data analysts of the M-Search and PSN teams have been combined to form a dedicated, highly knowledgeable team working together to apply best practices in data validation. Each member of our experienced team of data analysts is assigned to specific managers with whom they work closely to secure and validate the data.
The PSN database is powered by a rigorous data validation process designed by Informa that incorporates steps to ensure that the most complete and accurate data resides in the database at all times. Our process consists of four separate checks to provide data validation prior to the uploading of information to the database.
Automated Input Verification
During data input, Manager Neighborhood checks for incomplete, incorrect or inconsistent data. For instance, if a manager indicates that they use prior firm performance returns or simulated returns, the application will not allow the manager to exit the page without inputting a start or end date, ensuring that all data is complete.
Managers cannot input data that conflicts with data entered elsewhere in the application. For instance, the totals for assets in one area have to match the total in another area.
There are hundreds of automated checks run within Manager Neighborhood during the input process to prevent such incompleteness or inconsistency.
Manual Input Verification
In addition to the automated system checks, each new entry is reviewed by an experienced data analyst for consistency. Analysts will contact the manager when any of the following occurs:
· Data is inconsistent relative to the manager’s own historical information
· Data is inconsistent relative to market standards
· Data is inconsistent relative to other managers who manage similar products
Until the data verification is made, no new data will be uploaded to the database.
Change Verification
Whenever a manager makes a change to an entry, the data analyst specifically assigned to that manager is notified of the change. The data analyst receives a statement noting both the previous entry and the new entry. If the new entry varies significantly from the previous entry, the analyst will contact the manager to verify that the data is correct. Until this verification is made no new data will be uploaded to the database.
Pre-production Check
Prior to the final data being uploaded to the PSN database, there are additional automated checks that are run before the production cycle begins. Some examples of checks done at this phase of the process include the following:
· Duplicate firm names and duplicate product names under the same firm. Names do not have to match exactly for an alert to occur. Similar names will be flagged for the data analyst to manually review.
· Products that are reporting returns for a future date.
· Products that have no returns in any monthly or quarterly table.
· Firm/product “orphans”. Products must have an accompanying firm and each firm must have at least one product.
As with the other sets of checks, no data is published until all issues have been resolved.
Informa employs this meticulous data verification process to make certain that you are accessing information that has been continuously validated.
Questions about the data? Simply contact Client Service. Client service will inform the Data Services department who will immediately contact the investment manager in question.
Users can call or email the Client Service division with any suggestion about manager inclusion or data. Some clients ask us to solicit a manager to join our database so they can remain anonymous. Other clients will call the investment manager directly and tell them to join PSN.
To satisfy the needs of our diverse client base, Informa Investment Solutions is constantly on the lookout for new managers and investment products. Many of our clients make inclusion in PSN the mandatory starting point for all their searches.
We welcome your suggestions and referrals for firms and/or products: simply send your request to psndata@informais.com and we will do the rest. If you prefer, you can contact the manager and ask the manager to send us the information listed below.
An investment management firm can participate in the PSN database by sending an e-mail to psndata@informais.com with the following information:
1. Firm
v Name
v Address
v Assets under management
2. Data Contact information (the data contact is responsible for submitting the required information and communicating with Informa Investment Solutions on any data issues)
v Name
v Telephone number
v E-mail Address
3. Product List
v Specify the product name and asset class.
Upon receiving that email, the Data Services department of Informa Investment Solutions will set up the new database participant, and contact the Data Contact. The Data Contact can then provide complete data through Manager Neighborhood.
PSN Enterprise is a web-based application. Each licensed user is assigned a Login Name and Password to access PSN Enterprise on our company’s web site: www.informais.com. The information (graph and report templates, universes, custom templates, batched presentations, self-entered products and hybrids) created under the user’s Login Name and Password is proprietary to the user.
PSN Enterprise is comprised of the following:
Selection
Selection is the first screen to appear when you open PSN. This screen allows the user to locate and select the product(s) or retrieve a specific universe (either a PSN Published Universe or a User Created Universe) to view (and select the product(s) within this universe) before going to the Report area to generate graphs, reports or Firm/Product profiles.
Search
The Search screen allows the user to screen for a universe by selecting from the criteria listed in the Search Toolbar. The criteria available consist of Firm level data information (Firm Basics) and Product level (Product Basics) data information. The user can also screen for a universe based on statistical performance (Statistics or Advanced Stats).
Logic
Takes manager research and reporting to an important next level. Logic enables investment professionals to apply and effectively showcase their intellectual capital, fiduciary process, research philosophy and repeatable process.
Quick – Stat
The Quick-Stat screen allows the user to view calculated statistic performance for products, the product assigned benchmark, ADV Part I and II, Marketing Brochures, Compliance/Attestation Letter, Return Based Style Category breakdown, Latest Returns Available for products, Manager Web Site and Advanced View (create custom view).
Self-Entered System
The Self-Entered System is the user’s own input system. This allows the user to create or import proprietary products. This is maintained in PSN. The self-entered products can be used as a comparison against other products in the PSN database.
Hybrids
The Hybrid System allows the user to create hypothetical manager blends or index blends. Once created, the hybrid products can be used as a comparison against other products in the PSN database.
Reports
The Reports screen allows the user to create and save graphs, pre-set reports, custom reports (to export to Excel), Universe Reports and generate Firm and Product data and narrative profiles.
The Report Writer is located here. This function allows the user to create a custom report to export to Excel. Available to select: Firm Information, Product Information and Statistical Performance.
Depending on the PSN Version, the Statistics Writer function is also here. This function allows the user to create a statistical performance report which is exportable to Excel.
Batch Reports
The Batch Reports screen allows the user to compile graph templates (System and User Created), Firm and Product data and narrative profiles or Report Designer custom templates into a presentation. The presentation can then be generated in batch mode for multiple selected products. The output can be saved as a PDF file or PowerPoint file (graphs only). The saved presentation can be re-used again.
Report Designer
The Report Designer screen allows the user to create custom templates using available graphs, firm and product data and narrative information. The custom templates can be used again in the Reports and Batch Reports areas.
Setup
The Setup screen allows the user to re-set certain settings system wide. This includes system ending date, headings and footnotes in graphs and default colors and symbols in graphs.
Selection is the first screen to appear when you open PSN. At the Selection screen, you are able to:
Select the desired data set using the Data Set drop down list box
Retrieve PSN Published Universes by using the Universe drop down list box
Retrieve a saved universe by selecting the Retrieve Universe function
Search for a specific product using the Locate function
View a list of products and click on the Next Page button to see the next listing of products
Click the box next to the product name to select the product before proceeding to the Reports area
Within the Selection screen are the following functions:
Depending on your subscription, here are the available Data Sets:
ü Products (Gross of Fee)
ü Barclay Hedge Funds
ü Barclay Managed Futures
ü Lipper Mutual Funds
ü Market Indices
ü Morningstar Asia Pacific Funds
ü Morningstar Canada Funds
ü Morningstar Equities
ü Morningstar Europe Funds
ü Morningstar Exchange Traded Funds
ü Morningstar Close Ended Funds
ü Morningstar Global ETF Funds
ü Morningstar Middle East Funds
ü Morningstar Mutual Funds
ü Morningstar Off Shore Funds
ü Morningstar South Africa Funds
ü Morningstar United Kingdom Funds
ü Mutual Funds
ü Products – Net of Fee
ü SMA Indices
ü Self-Entered
ü Hybrids
For the entire help system, we will use the term “product or products” to indicate one or more items from one or more of the data sets listed above.
The universe drop down box lists the PSN Published Universes. There are two types of PSN Universes available. The first type is Manager Defined universes based on Primary Fields: Primary Investment Style, Primary Market Capitalization and for Fixed Income Primary Maturity. These Primary Fields are located in the Product Data Profile. A participating manager is asked to choose only one option for these fields.
The second type is Return Based Style Analysis (RBSA) universes. To retrieve a PSN Universe:
Click the Universe window drop down button
Highlight the name of the PSN Published Universe.
The firm/product count will be listed under the Universe drop down box.
Note: User created universes can also be selected from this drop down box.
In the Locate box, type in the first few letters of the firm name and click on the Go button.
Note: Use the Locate Option drop down window (click on >>) to locate a firm by: Any of the words, All of the words or Exact Phrase.
The Clear All button is used to turn off the selected products across all data sets. To turn off the checkmark(s) next to the product(s), click on the Clear All button.
This button is used to re-arrange the order of appearance (the selected products) in the graph legend. To use the function:
Use the Data Set drop down window to select the desired data set.
Use the Locate box to find the product(s).
Click the box next to the product name to turn on the checkmark to select the product (Note: Most graphs in PSN allow a maximum of 30 observations to be highlighted in the graph legend)
Click the Save/copy Selected button
Use the Up and Down arrow buttons to re-arrange the order
Click Reports on the main toolbar to go into the graphics/reports area OR click on the Save Current Selection button to save the selected products as a custom universe.
The Retrieve Universe button allows the user to retrieve user created universes. User created universes can be created using the Search function or by hand selecting the products to create a custom universe. To use this function:
Click the Retrieve Universe button
The Universe Directory screen will appear
Under the Name column to the left, locate and select the universe to retrieve
A reminder screen will appear, listing the Short Abbreviation, Description, Member Types, Screening Date, Members Count, List of Criteria used to create the Universe
At the bottom of the screen, click on the Load <name of saved universe> button.
Note: When you save a universe, it becomes a static universe. By clicking on the Load <name of saved universe> button, you are retrieving the same list of products that met your criteria at the time the Universe was created. If you want the universe to be dynamic (new products added to the saved universe over time), check off Update members after loading before clicking on the Load <name of saved universe> button. The system re- screens the universe with the same criteria listing. This function should be done on the 15th of every month when the manager database is updated.
Click the Retrieve Universe button located to the right side of the Selection screen
Under the Universe Directory, the saved universes and custom universes will be listed. Locate and place a checkmark in the square box to the far right of each saved universe or custom universe to be deleted
Click the Deleted Selected button at the bottom of the screen
This function is used when a manager is missing a return(s) for a product and you want to transfer the historical returns to the Self-Entered System. You have the option to enter the missing return(s) and save as a self-entered product. You can graph the product as a self- entered product:
At the Selection screen, locate and check off the square box next to each product(s). Use the Data Set drop down window to locate other product types (market index, self-entered product, hybrid, mutual fund, etc.).
Click the View Selected button
Click the Copy to Self-Entered button. A message will appear: Successfully copied
Select Self-Entered on the main tool bar
The Self-Entered Directory will appear
Under the Self-Entered name column, select the product copied over
The Edit Self-Entered screen will appear
Scroll down the screen to the historical return grid
Click inside the return box and enter the missing return (click on the Tab key to move over to the next box if necessary)
Click the Save button
Note: Only Products and Market Indices can be copied to self-entered.
The Select Universe button will be activated when the user retrieves a PSN Published Universe or a saved universe from the Universe drop down window. To use the function:
Click the Universe drop down button and highlight the universe to retrieve
Click the Select Universe button to turn on the checkmarks for all products
Click Reports on the main toolbar to go into the graphics/reports area and generate reports for the selected products OR click on the Export ROR button to export the historical returns to Excel.
The Export ROR button is used to export the historical returns of a retrieved universe. To use the function:
Click the Retrieve Universe button. The Universe Directory will appear
Under the Name column to the left, click on the saved universe name
The name of the selected saved universe will appear. Click on the Load <name of saved universe> button to retrieve the products in the saved universe
Locate the Select Universe button (to the right) at the bottom of the screen and click on it
The system will turn on the checkmarks for all the products
Click the Export ROR button
Choose the Period Type to export: Monthly or Quarterly
The system will export by default the historical returns for each product in the universe going back to inception (for the product). However, you have the option to specify the Begin Year and/or the End Year. Note: If the performance for a particular product starts AFTER the selected Begin Year, the inception date column will hold the actual inception date.
Click the Export ROR to Excel button
Note: This function is only available to PSN Platinum level Users
The Compare Selected function is used to isolate the selected products and view their performance. To use the function:
Use the Data Set drop down window to select the desired data set. Use the Locate box to find the product(s). Check off the box next to the product name to select the product.
Click the Compared Selected button
The Current Stat drop down window will appear. The window will default to the Rate of Return statistic. To view a different statistic, use the drop down button and re-select a statistic from the listing. Available dates shown on this screen are: Latest Month, Quarter, 1 Year, 2 Year, 3 Year, 4 Year, 5 Year, 6 Year, 7 Year, 8 Year, 9 Year and 10 Year.
At the Search screen, you are able to:
· Go to the Search area and construct a universe by selecting from the criteria listed.
· Click the View Results button to retrieve your new universe members and the corresponding product and manager count.
· Click the Save Universe button to save the results as a User Created Universe.
· Select a PSN Published Universe from the Universe drop-down box. Once the universe is selected, screen down the universe further by clicking on Search.
· Add screening criteria as required and then save your universe by clicking on Query and Keep Results as Universe or Save Universe buttons.
Select any criteria within the following categories:
Product level information including database and asset class, investment styles, market capitalization, decision making process, fixed maturity, fixed duration, AIMR-PPS/GIPS compliant, open for investment, offered as mutual/commingled fund, offered as wrap/tamp program, performance incentive fee, manager tenure, manager designated benchmark, wrap products and wrap sponsor.
Firm level information including location, type, legal structure, year founded, percentage owned by employees, total assets under management, tax-exempt and taxable assets, non-US assets, ownership, minority owned and firm ownership break-down.
Firm assets break-down by investment approaches (US Equity, US Fixed, US Balanced, US Cash, International Equity, International Fixed, International Balanced, International Cash, Global Equity, Global Fixed, Global Balanced and Global Cash), U.S. Tax Exempt, U.S. Taxable and Non-US client assets and client types.
Available for searching based on statistical performance. The Statistics screen is set up in a drop-down window format with the following:
Statistics against Benchmark
Select the statistic, time period, operator (greater than, less than, greater or equal and less or equal), relative to a selected benchmark
Statistics against Values
Select the statistic, time period, operator (greater than, less than, greater or equal and less or equal), relative to a selected minimum value, maximum value or a range in value.
Statistics against Percentile
Select the statistic, time period, and comparison universe, rank is (greater than, less than, greater or equal and less or equal) and Percentile
Note: Greater than=higher numerical percentile ranking
Less than=lower numerical percentile ranking
Select the Equity or Fixed Income investment styles for screening. The manager is asked to rank each investment style from 1 to 5: 1= Very Important, 2= Important, 3=Utilized, 4=Not Utilized and 5=Not Important.
Select a statistic(s) and enter a Custom Date range(s) for statistical performance screening.
Select Product Information in the following categories: Total Assets and Accounts, Fees and Portfolio Turnover, Assets and Accounts by Tax Status, Total Assets and Accounts by Account Type and Median Account Size.
Here are some of the available fields: Average Maturity, Average Duration, Average Yield to Maturity %, Average Coupon%, Quality Distribution, Sector Distribution, Maturity Distribution and Duration Distribution
Here are some of the available fields: % In ADR's Low and High, % In Ordinary Shares Low and High, % Cash Reserve Low and High, % In Hedged Low and High, of Stocks Low and High, Max in one Security %, Max in one Industry %, Max in one Sector %, Max in Equity % , (balanced products only), Max in U.S. %, Max in Single Non-U.S. Country %, Max Outside of U.S. %, Micro Capitalization (<500 $Million), Small Capitalization (>500 $Million - <2 $Billion), Medium Capitalization (2-10 $Billion), Large Capitalization (10-50 $Billion), Mega Capitalization (> 50 $Billion), Industry Sector Breakdown, Equity Characteristics.
Select Global Product information in the following categories: Query for Developed Countries, Query for Emerging Countries and Query for Geographic Regions.
Select the Firm and Product Narratives in the following categories:
Firm Narrative - Here are some of the available fields: Organization and Ownership, Product Offerings and Services, Business Objectives and Strategy, Investment Approaches, Senior Investment Professional information (Name, Professional Accreditation, Present Job Position, Undergraduate Institution, Previous Company Name, Responsibilities in this Firm, etc.)
Product Narrative - Here are some of the available fields: Investment Philosophy, Investment Decision-Making Process, Portfolio Construction, Investment Approach, Key Investment Officer information (Name, Professional Accreditation, Present Job Position, Undergraduate Institution, Previous Company Name, Responsibilities in this Firm, etc.)
View Results button
Click on this button anytime you wish to see the list (including manager and product count) that matched your criteria. To come back, click on the Search tab again.
Query and Keep Results as Universe button
Click on this button when you want to complete your current search session and save your criteria and the list of products.
Clear Criteria button
Click on this button when you want to start fresh, delete all of your current criteria and bring the entire universe of products back.
Save Universe button
Click on this button when you want to complete your current search session and save your criteria and the list of products.
Full Universe button
Click on this button when you want to delete all of your current criteria and bring the entire universe of products back.
Retrieve Universe button
Click on this button when you want to retrieve one of your saved universes.
Create a Universe Using the Search function:
Click the Search function on the main toolbar
Note: You can also retrieve a PSN Published Universe (from the Universe drop-down window at the Selection screen) as the starting point, and click Search to screen down further.
The Product Basics category will appear
· Select the desired Database and Asset Class: U.S. Equity, U.S. Fixed Income, U.S. Balanced, Non-U.S. Equity, Non-U.S. Fixed Income, Non-U.S. Balanced, Global Equity, Global Fixed Income and Global Balanced
· To create an Equity Universe: Under the Equity Options, select the desired Investment Style(s), Market Capitalization(s) or Equity Decision Making Process(s)
· To create a Universe Fixed Income: Under the Fixed Options, select the desired Fixed Income Style(s), Fixed Maturity(s), Fixed Decision Making(s) or Fixed Duration(s)
Note: At any time, to view your screening results, click the View Results button. The system will process the screening and show the current criteria selected and the current firm/product count. Click Search to go back or click the Save Universe button to save results as user universe.
· For Non-U.S. or Global Universe with a specific Geographic Concentration region, select the desired region in the Geographic Concentration:
Asian (Ex-Japan), Canadian, Continental Europe, EAFE, EAFE (Ex-Japan), EAFE (Ex-Pacific Basin), EAFE (Ex-UK), Emerging Markets (All Regions), Europe (Ex-UK), Europe (including UK), Global, International (Non-U.S.), Japan Only, Latin America, Other, Pacific (Ex-Japan), Pacific Basin or United Kingdom
· Select the desired Investment Approach: Index Enhanced, Index Passive or Active
· Under Other Options, select the desired product data fields. Here are some of the available fields: Offered as Mutual Fund, Offered as Commingle Fund, and Open for Investment, AIMR –PPS/GIPS Compliant
· Select the desired Minimum Fee and Account Size. Here are some of the available fields: Institutional or High Net Worth SMA Minimum Annual Fee and Account Size, Mutual Fund Minimum Annual Fee and Account Size, Hedge Fund Minimum Annual Fee and Account Size
· Other available product data fields to select for screening include: Manager Tenure, Weighted Average Market Cap, Manager Designated Benchmark and Wrap Sponsor
Note: At any time, to view your screening results, click the View Results button. The system will process the screening and show the current criteria selected and the current firm/product count. Click Search to go back or click the Save Universe button to save results as user universe.
· Select Firm Basics category to screen for firm information
· Select the desired Firm Location: City, State, Country
· Select the desired Firm Type, Legal Structure and Year Found and %Employee Owned
· Select the desired Firm Assets. Enter the minimum and/or maximum assets amount in Millions (i.e. 1000 = 1 Billion) for screening. Here are some of the available firm assets: Total Assets Under Management, Total U.S. Tax-Exempt Assets, Total U.S. Taxable Assets, Total U.S. Assets and Total Non-U.S. Assets
· Select to screen for Minority Owned (Yes or No)
· Select the desired Firm Ownership by entering the minimum and/or maximum percentage: American Indian/Alaskan Native, Hispanic, Women, Asian, African American, Disabled, Disabled Veteran and Overall
· Select the Assets Breakdown category to screen for Investment Approach and Client Assets:
· Select the desired Investment Approach. Enter the Minimum and/or Maximum value in Millions (i.e. 1000 = 1 Billion)
· Select the desired U.S. Tax Exempt client asset(s). Enter the Minimum and/or Maximum value in Millions (i.e. 1000 = 1 Billion)
· Select the desired U.S. Taxable client asset(s). Enter the Minimum and/or Maximum value in Millions (i.e. 1000 = 1 Billion)
· Select the desired Non-U.S. client asset(s). Enter the Minimum and/or Maximum value in Millions (i.e. 1000 = 1 Billion)
· Select Statistics category to screen based on performance. There are three options:
Statistics against Benchmark
From the drop-down boxes, select the statistic, time period, operator (greater than, less than, greater or equal and less or equal), relative to a selected benchmark
Statistics against Values
From the drop-down boxes, select the statistic, time period, operator (greater than, less than, greater or equal and less or equal), relative to a selected minimum value, maximum value or a range in value
Statistics against Percentile
From the drop-down boxes, select the statistic, time period, and comparison universe, rank is (greater than, less than, greater or equal and less or equal) and Percentile
Note: At any time, to view your screening results, click the View Results button. The system will process the screen and show the current criteria selected and the current firm/product count. Click Search to go back to screening or click the Save Universe button to save results as user universe.
· Select the Advanced Statistic (Adv Stats) category to screen based on performance
· Click the Select Statistic drop-down window to select the desired statistic. The Date Range box will appear
· In the Type of Date Range drop-down box, select the macro dates from the listing:
Latest Month, Latest Quarter, Year to Date, 1 Yr, 2 Yr, 3 Yr, 4 Yr, 5 Yr, 6 Yr, 7 Yr, 8 Yr, 9 Yr, 10 Yr
· To enter your own custom date, use the Date Range boxes. Type in the beginning date and the ending date
Note: For certain statistics, you are required to select an appropriate Risk Index. Select the risk index from the Risk Index drop-down box or click the orange button (with 3 dots) to bring up the Data Set drop-down box and select from the available data sets.
· You have the option to screen for products that outperform a Value. Enter the Minimum and/or Maximum Value
· Select the Period Type: Quarterly or Monthly. The system defaults is Quarterly
· You have the option to screen for products that outperform based on Percentile. Enter the desired percentile Minimum and/or Maximum Value
· Click OK button
· For Equity Universe, select the Product Information (Product Info) category to screen for: Product Total Assets and Accounts, Fees and Portfolio Turnover, Assets and Accounts by Tax Status, Total Assets and Accounts by Client Type, Median Account Size
· For Fixed Income Universe, select Fixed Income (Fixed) category to screen for: Average Maturity, Average Duration, Average Yield to Maturity %, Average Coupon %, Quality Distribution, Sector Distribution, Maturity Distribution and Duration Distribution
· For Non-U.S. or Global Universe, select Global to screen for:
Query for Developed Countries, Query for Emerging Countries and query for Geographic Regions
· Select the Narratives category to screen for qualitative information in the Firm and Product Narratives. The available fields include:
Firm Narrative - Here are some of the available fields: Organization and Ownership, Product Offerings and Services, Business Objectives and Strategy, Investment Approaches, Senior Investment Professional information (Name, Professional Accreditation, Present Job Position, Undergraduate Institution, Previous Company Name, Responsibilities in this Firm, etc.)
Product Narrative - Here are some of the available fields: Investment Philosophy, Investment Decision-Making Process, Portfolio Construction, Investment Approach, Key Investment Officer information (Name, Professional Accreditation, Present Job Position, Undergraduate Institution, Previous Company Name, Responsibilities in this Firm, etc.)
· Click the View Results button to process the screening
· Click the Save Universe button to save results as a user universe.
· At the Selection screen, locate and check off the square box next to each product(s). Use the Data Set drop down window to locate other product types (market index, self-entered product, hybrid, mutual fund, etc.).
· Click on the View Selected button
· All the selected products will be listed in the window. Use the black Up and Down buttons to the right of the screen to change the order of appearance. (Note: the order of appearance will be saved. This will be the same order as seen in the legend of the graph(s) when you go to the Reports area).
· Click on Save Current Selection button
· Enter Short Abbreviation and Description for the universe and click the Save button
· At the Selection screen on the main tool bar, click Retrieve Universe button (located in the upper right hand corner of the screen)
· Click Create Merged button
· Enter the name of the merged universe (Short Abbrev/Description)
· Under Universe Option, select the universe type (PSN Published Universes, Non-Published Universes, etc). The universes will be loaded into the window for you to select
· Select the universe and click the > button to add to the Universe to be Included window. Repeat to add more.
· Click Save button
· The Universe Directory screen will appear. The merged universe will be listed
· To retrieve the merged universe, under the Name column, select the universe name and click on Load <name of universe> button
Logic enables investment professionals to efficiently apply and effectively showcase their
· Intellectual capital
· Fiduciary process
· Research philosophy
· Repeatable process
Every great database has a search and selection function that allows the pros to screen managers down to a select list or finalists; only Logic allows you to show which ones fell from the list at each stage and why. And, only Logic satisfies the increasing need to demonstrate fiduciary responsibility and a repeatable process. Logic is immediately available to PSN Enterprise Platinum subscribers. · On the fly Pass/Fail analysis allows the user to see search constituents who are successful or unsuccessful for inclusion in the search · Breakdowns for constituents can be done for individual search criteria or the cumulative set of selected criteria · “Force Pass/Fail provides the user the authority to be inclusive or exclusive of products that have either failed or passed the search · “Report Card” offers the user to have more transparency into a product’s performance, providing the ability to drill in on a particular manager to see why they passed or failed specific criteria. · Advanced Report Writer delivers on the fly previews of selected criteria, search column definition, advanced sorting with drag and drop functionality, and a “ghost filter” mode for masking criteria from the final report. · Smart Exporting gives the user the ability to export their custom reports to Excel with a record of the Filter Constituents and their individual and cumulative pass/fail analysis · New Criteria Search enables the user to quickly and easily find criteria by name for use within a product search enabling prioritization of criteria within a research construct. · “Beats” functionally allows querying based on exceeding a benchmark, over a percentage of multiple time frames, for each criterion. Similar to PSN’s Batting Average, Beats can be calculated for every statistic. · Formula feature allows for the creation of custom algorithms for assigning weightings to specific criteria for use within queries and numeric function allows numeric values to be assigned to non-numeric criteria for use within queries. · All queries can easily be seen in PSN’s “Quick View” Reports, be saved as universes, and shared across the enterprise. |
Put Logic to work for you today! Contact PSN Client Services today for a personalized tour or training on Logic or any aspect of PSN’s manager research and due diligence solutions.
Contacts
www.informais.com
clientservices@informais.com
914-509-1577
The Quick-Stat screen allows the user to view: (this function is not available for Self Entered and Hybrid Products:
· Calculated statistic performance for selected universe. This can be exported to Excel.
· Product assigned benchmark: PSN designated and Manager designated
· ADV Part I and II, Marketing Brochures, Compliance /Attestation Letter. The user can view the information on-line or save as PDF file
· Return Based Style Category breakdown
· Latest returns available for products. Returns are posted the next business day in PSN
· Manager Web Site
· Advance View allows user to create custom performance and data columns to view and export to Excel
Available functions under Quick-Stat:
The Statistic screen shows calculated performance for a selected statistic (use the Current Stat drop down window to choose the desired statistic.) Available dates shown on this screen are: Latest Month, Quarter, 1 Year, 2 Year, 3 Year, 4 Year, 5 Year, 6 Year, 7 Year, 8 Year, 9 Year and 10 Year. To sort performance descending, click once on the column header name. The Statistics screen is refreshed on the 15th of every month.
Returns are refreshed on the next business day after a manager updates their performance. The Latest screen allows the user to view the latest returns as of that day. You can also view the returns prior to the latest year by clicking on the Year drop down window to the right of the screen.
The Advance View function allows the user to re-select the performance/data columns to view. The user can also save this view. To create a new view and export to Excel:
Note:Advance View only works with Data Set: PRODUCTS. Load a universe or select the desired product(s) at the Selection screen before going to Advance View
Click the New View button located at the bottom of the screen
Enter the name of the view in the View Name box
Under the Available Fields window locate and select the field(s)
Click the Save button. The saved view listing will appear
Highlight the view to generate
Click the Back to Advance View button to process the view on screen
Click the Export to Excel button at the bottom of the screen to export the view to Excel
The Benchmarks screen lists the PSN Designated Benchmark for the product (each product is assigned a PSN default benchmark base on how the manager completes the Primary Investment Style, Primary Market Capitalization and for Fixed Income Primary Maturity fields in the Product Data Profile), the Manager’s Designated Benchmark selection and the product’s assignment to a PSN Published Universe.
The Return Based Style Analysis category breaks-down (T-Bills, Large Value, Large Growth, Medium Value, Medium Growth, Small Value, and Small Growth).
The product’s ADV Part I, ADV Part II, Marketing Brochures and Compliance/ Attestation and a short video. Letter are available to view online or download by saving as a PDF file.
This screen allows the user to click on the manager’s web link to go directly to the manager’s home web site to do more research.
Universe count gives you the count of available managers within a universe and the count of how many have data as of the current quarter.
The Self-Entered System is located on the main tool bar. This is the user’s input system for proprietary return sets (products, indexes and portfolios). The user has the option to maintain a separate database in PSN using the Self-Entered System. Once the self-entered product is saved, it is available to be graphed with other products in the PSN database. To create a self-entered product:
· Select Self-Entered located on the main tool bar
· Select New Self-Entered
· Enter the Firm Abbrev
· Enter the Product Abbrev
· Enter the Description
· Enter the Date as of Date (this field is option, you can leave it blank)
· Select Period Type: Quarterly or Monthly
The following fields are optional (you can leave them blank):
Assets
Type
Default Return Type
Scope
Primary Investment Style
Primary Market Cap
Primary Maturity
Primary Decision Making
The following two fields you may want to use:
Default Benchmark
Default Universe
· You have the option to assign a Default Benchmark or a Default Universe for the self-entered product. In the Reports area under the Single Manager tab (manager versus benchmark analysis); the system will bring up the assigned benchmark for the self-entered product as comparison. If you create any universe charts, the system will also bring up the assigned universe.
· Enter the inception year in the Performance begins on year (yyyy) box. This field is required to generate the ROR grid for inputting returns. Click the Accept button.
· The historical return grid will appear at the bottom of the screen. Enter the returns. Click the Tab key to move over to the next box.
· Click the Save button
Note:If you have the historical returns in Excel with the following: Single column format, left justified, Earliest Dates to Latest dates from top to bottom and negative number using minus sign (no brackets), you can select the Import Historical Rates of Returns button:
· Step 1 - Enter the first quarter or month for which you have return information
· Step 2 - Copy and Paste the returns from Excel spreadsheet to the available window
· Step 3 - Click OK button
· Click the Close Window button to go back to the main Self-Entered screen
· Click the Save button
You can use the Upload Center function to import a large number of self-entered products into PSN. The import file has to be in the PSN specified format:
Upload Rules:
· Your file must be a comma separate value ("CSV") file.
· Your CSV file cannot exceed 500K. Depending on the performance history of each record, this roughly translates to 500 self-entered products or so.
· Each record must be completed and dictated by the RECORD FORMAT for the Upload Center.
· Once the upload process is started, you can proceed to perform other tasks in PSN Enterprise.
· If a record is new, that record will be inserted into the system by the upload process.
· If a record currently exists in PSN Enterprise, it will be updated by the upload process.
· An email will be sent to your inbox once the entire upload process is completed.
Each record in the CSV file must be in the following format ("RECORD FORMAT"):
· Each data field must be separated by a comma.
· Text must be surrounded with quotation marks.
· Number and date must have no quotation mark.
· Each data field is provided from left to right as indicated below:
o Firm Abbreviation ("20 characters max")
o Product Abbreviation ("20 characters max")
o Description ("60 characters max")
o Product ("36 characters max")
o Return Type ("Pre-tax gross of fees", "Pre-tax net of fees")
o Period Type ("Monthly or Quarterly")
o Fiscal Year End Month (12)
o Performance Begin Date (mm/yyyy)
o Performance Values (#1, #2, #3, … #n)
To proceed, please select a Comma Separated Value (CSV) file to upload:
· Click the "Browse" button
· Find a file on your computer and select it
· Click the "Open" button
· After file is selected, click the "Upload" button
· Once the process is completed, you will receive a confirmation e-mail from IIS informing you of the status of your upload.
· Once the self-entered product is saved, it will be available for you to select for reporting. To select the self-entered product, go to the Selection screen. In the Data Set drop down window, bring up the Self-Entered listing.
The Hybrid System is located on the main tool bar. It is a powerful tool that allows the blending of any combination of manager returns and market indexes to help you determine what mixture of products will meet your risk and return criteria. PSN will calculate the performance of the hybrid based upon your mixture and re-balancing criteria. The hybrid can be profiled and incorporated in any graph or report as a separate product.
· At the Selection screen, locate and select the members to create your hybrid
· Select Hybrids on the main toolbar
· Under Options, type in the Hybrid Name and the Description
· Select one of the following in Mixing Mode:
o If member has no ROR for a period, rebalance its % to the rest of the members
o If member has no ROR for a period, make hybrid ROR = N/A from this period on
· Type in the Initial Amount (optional). Use this option if you want to generate the hybrid mixing results to export to Excel or to proceed to the Advanced function to add Contributions, Withdrawals and Fees.
· The default Time Period is Common (The system will find the common start date for all members). You have the option to select the following Time Periods:
Longest - System selects start date based on product with the greatest longevity.
Other - Use if you want to select a specific quarter/month start date by entering Start Date field with the user selected date.
· Select the Rebalance Period from drop down menu requiring the system to restore the original percentage allocations to the blend members for the period selected. System defaults to No Rebalance.
· Type in the percentage for each member under the Allocation % column (total must equal to 100%)
· To create a custom benchmark for your manager blend, select I want to Build Custom Benchmark. The system will choose a default benchmark for each item using the same allocations as those applied to the hybrid members. The user can re-select the benchmark by using the drop down box to the right of the item. Select the appropriate risk index for each member.
· Under the Advanced button, you have the option to set up Contributions/Withdrawal, Add Fees and Add Rebalanced Thresholds for your hybrid:
· In the Product drop-down box, select member
· In the Beginning Date drop-down box, select the beginning date (the default date is the common date for all members)
· In the Frequency drop-down box, select the frequency
· In the Amount drop-down box, type in the dollar amount (i.e.: 10,000). Use minus sign for Withdrawal (i.e.: -10,000)
· Click the OK button
· Click on Apply button
· In the Product drop-down box, select All Manager or a specific member
· In the Beginning Date drop-down box, select the beginning date (the default date is the common date for all members)
· In the Frequency drop-down box, select the frequency
· In the Percent drop-down box, type in the fee percentage (i.e.: ten percent = 10)
· Check off the De-annualize if you want the system to proportion the annual fee percentage for each member on a quarterly basis
· (i.e.: select quarterly frequency and check off De-annualize)
· Click the OK button
· Click on Apply button
Add Rebalance Threshold:
· This function allows the user to set the allocation limit for each member. For example, if the initial weighting for member A is 75% and the actual allocation (based on performance) is 90%, you can apply an Up Threshold of 10, which means the system will force a rebalance (back to 75%) if the actual allocation for the member exceeds 85%.
· In the Product drop-down box, select the member you want to set the threshold
· In the Up Threshold drop-down box, enter the offset from the initial allocation. If the actual allocation goes above the initial %, plus this offset, the system will force rebalance
· In the Down Threshold drop-down box, enter the offset from the initial allocation. If the actual allocation goes below initial %, minus this offset, the system will force rebalance
· Click the OK button
· Click the Apply button
· Once all desired settings have been applied, click the Save Mix button to save the Hybrid
· Click the Blended Results button to view the mixing report. Click on Export to Excel button to extract mixing report to Excel
· Click the Return & Risk button to view the saved hybrid statistics: ROR, Standard Deviation and Dollar Growth.
· Once the Hybrid product is saved, it will be available for you to select for reporting. To select the Hybrid product, go to the Selection screen. In the Data Set drop down window, bring up the Hybrid listing.
Asset Allocation Optimizer
This function is located in the Hybrids area. It is used to find an optimal solution (preferred percentages) that is efficient in building the hybrid (Note: make sure all members have same end date).
The information is viewed on the screen.
· At the Selection screen, locate and select the members to create your hybrid
· Select Hybrids on the main toolbar
· Select Hybrids
· Under Options, type in the Hybrid Name and the Description
· Select one of the following the Mixing Mode:
If member has no ROR for a period, rebalance its % to the rest of the members
If member has no ROR for a period, make hybrid ROR = N/A from this period on
· Type in the Initial Amount (optional). Use this option if you want to generate the hybrid mixing results to export to Excel or to proceed to the Advanced function to add Contributions, Withdrawals and Fees
· The default Time Period is Common (The system will find the common start date for all members). You have the option to select the following Time Periods:
Longest - System selects start date based on product with the greatest longevity.
Other - Use if you want to select a specific quarter/month start date by entering Start Date field with the user selected date.
· Select the Rebalance Period from drop down menu requiring the system to restore the original percentage allocations to the blend members for the period selected. System defaults to No Rebalance.
· Click on Select Optimal Solution button
· Under Chart Parameters to the left, select Allocate Manager Selection for manager blend or Allocate Indices Selection for index blend
· To the right of the screen is the Efficient Frontier curve. Each point on the curve represents the return versus risk tolerance.
· Select a point that represents your return versus risk tolerance. The system will apply the appropriate allocation for each member based on your selection.
· Click on Accept button at the bottom left of the screen to go back to the Hybrids/Options screen. The system will re-apply the percentage for each member based on the Risk Tolerance point selection.
· Click the Save Mix button
Additional Options:
Allocation– Shows the ROR, standard deviation and allocation for each point on the efficient frontier curve. It allows you to sort and select a point.
Correlation – Shows how the members correlate to each other. It allows you to edit the correlation matrix and/or ROR and Standard Deviation.
Best/Worst– Shows the best and worst returns (calendar years) and the best and worst risk (rolling three years) for the members
Risk Tolerance – Shows the color-coded risk legend from low risk to high risk
Constraints – Allows the user to apply minimum and maximum allocations for each member
Group Constraints– Allows the user to link more than one member together as a group and apply minimum and maximum allocations for the group.
The Monte Carlo function is located in the Hybrids area. Thisfunction allows the user to apply the available parameter settings to view the probability of growth over time for the portfolio.
The information is viewed on the screen.
How to use the Monte Carlo function:
· At the Selection screen, locate and select the members to create your hybrid
· Select Hybrids on the main toolbar
· Under Options, type in the Hybrid Name and the Description
· Select one of the following
the Mixing Mode:
If member has no ROR for a period, rebalance its % to the rest of the
members
If member has no ROR for a period, make hybrid ROR = N/A from this period on
· Type in the Initial Amount (optional). Use this option if you want to generate the hybrid mixing results to export to Excel or to proceed to the Advanced function to add Contributions, Withdrawals and Fees
· The default Time Period is Common (The system will find the common start date for all members). You have the option to select the following Time Periods:
Longest - System selects start date based on product with the greatest longevity.
Other - Use if you want to select a specific quarter/month start date by entering Start Date field with the user selected date.
· Select the Rebalance Period from drop down menu requiring the system to restore the original percentage allocations to the blend members for the period selected. System defaults to No Rebalance.
· Type in the percentage for each member under the Allocation % column (total must equal to 100%).
· Select the Monte Carlo button.
· The Monte Carlo Simulation screen will appear.
· The Parameters listing is located on the left side of the screen. Available parameters to apply:
Number of Iterations – The default is 1000. You can enter another value from 500 to 5000.
Inflation Rate – Enter the desired inflation rate
Target Value – Enter the desired target value
Target Annual Return- Enter the desired target annual return
Initial Amount- Enter to desired initial amount (i.e. $1 Million entered as 1000000)
Time Horizon (Years) – Enter the time frame in years
Note:The Annual ROR and Standard Deviation values listed are based on the historical returns of the hybrid
· Click the Accept button
· The results will be shown on two graphs located on the left side of the screens:
Probability on Growth
This graph will plot (in a line format) the growth of the Portfolio Value over Time and the probability in percentage of achieving the expected growth.
Range of Asset Values
This graph will plot (in a bar format) the growth of the Portfolio Value over Time.
· Click the Back button to go back to the Hybrids/Options screen.
Note:The Monte Carlo button is also located in the Asset Allocation Optimizer.
The Reports screen allows the user to generate:
· Graphs
· PSN Profiles
· Report Writer
· Universe Reports
· Report Designer custom templates
Export Graphs
All graphs and reports are generated by default in a PDF file format. However, the user can click on the Export button at the bottom of the screen to export to: Microsoft PowerPoint, Word, Excel or Windows Metafile.
Maximum Dates and Statistics
For Multiple Dates graph templates, you have the option to select up to 12 dates. For Multiple Statistics graph templates, you have the option to select up to 12 statistics.
The Reports screen is divided into two areas. The graph or report output is on the right side. The menu is on the left side of the screen and listed in a tab format. Here are the available tabs:
Available system graph and report templates that can accommodate up to 30 observations (products, risk indexes, mutual funds, self-entered products and hybrids); the Report Writer (or Statistics Writer) is also located here.
Available system graph and report templates that can accommodate only one selected product and the PSN Default Benchmark for the product (Note: the user can re-select the benchmark); manager versus benchmark analysis.
Available system graph and report templates that will let the user create and graph a custom manager blend or index blend on the fly with the option to save the hybrid blend. The graph format is the same as Single Manager: Only one Product versus Benchmark analysis.
Available system graph and report templates that will let the user create and graph a custom manager blend or index blend on the fly with the option to save the hybrid blend. The user is able to add “multiple scenarios” of differing percentage allocations for of the blend members and rebalance modes of the hybrid. The multiple scenarios will be listed in the graph(s) for comparison.
The PSN Profiles display all the data available for PSN Firm and Product listings within multiple profile formats. Depending on your subscription level these may include:
· Executive Summary
· Executive Summary 11
· Firm Assets- Client Type
· Firm Data
· Firm Narrative
· Firm Policy & Procedures
· Firm Summary
· Performance Historical ROR by Period
· Performance ROR vs Benchmark
· Performance Summary
· Product Assets - Historical
· Product Assets – Summary
· Product Data Profile
· Product Fee Summary
· Product Holdings –Full
· Product Holdings - Summary
· Product Narrative
The PSN Profiles can be saved as a PDF file.
· ADV Part I and II
· Compliance and Attestation Letters
· Marketing Brochures
The user can download the information by saving it as a PDF file.
Best and Worst Performers- Select the universe, the statistic and one date. This report highlights the Best and Worst performers within the universe. The use has the option to select the number of products to highlight (i.e. the top 10 and the bottom 10).
Distribution Threshold- Select the universe, the statistic and multiple dates. This report allows the user to highlight the universe in different tiles (user enters the desired tile, it can be 10, 20, 25, etc.) for multiple date ranges.
Percentile Report- Select up to 8 universes and up to 8 system macro dates. The report highlights the Distribution break down (High, First Quartile, Median, Third Quartile, Low and Mean) for each selected universe.
Percentile Writer- Select the products (to generate the report), multiple statistics, multiple dates and universes. This report shows the value and the percentile ranking for each selected products within the selected Universe. Also included is the distribution break down for each statistic (High, First Quartile, Median, Third Quartile, Low and Mean).
Universe Fee - Select up to 8 universes and one date. This report highlights the Distribution break down (High, First Quartile, Median, Third Quartile, Low and Mean) for $Million Account Size, $5 Million Account Size, $10 Million Account Size, $25 Million Account Size, $50 Million Account Size and $100 Million Account Size. The dollar amount is in thousands.
Universe Percentile- Select one universe, select one statistic with multiple dates or one date with multiple dates. This report highlights the percentile ranking and value for each product within the selected universe. All the Universe Reports can be export to Excel.
Graph and Report Templates previously created and saved by the user.
Reports uploaded from an external source. Available file format to import: Adobe PDF, Microsoft Word, Excel, PowerPoint and Text file. Once uploaded into PSN, it is saved as a template. The uploaded template can now be used in the Batch Report area to create presentation.
These are Graph and Report Templates previously saved by the user and transferred (by the user) to this Public Folder. This function allows the user to share the saved templates with other colleagues (they must be assigned user licenses to access to PSN). In order for this function to work, everyone (PSN user licenses) must be grouped together under a department name (i.e. Marketing, Research, etc.) by PSN.
These are the customized templates created and saved by the user using the Report Designer function on the main toolbar. Please see: Report Designer in section 3
This function allows the user to create and build a custom benchmark (index blend) to use as a comparison for the selected product under the Single Manager tab. To create a Custom Benchmark:
· Click Custom Benchmark located on top of the main Reports screen
· Use the Type drop down box to locate and select the members to build a custom benchmark. Available types include: market indexes, products, self-entered products, mutual funds, etc.
· Click Next button
· Enter the name in the Custom Benchmark box
· Enter the description in the Description box
· Select Mixing Mode
· Select Time Period
· Select Rebalance Period
· Enter the percentage allocation for each member. The total has to equal to 100%
· Click Finish button
To use the Custom Benchmark created:
· Go to Single Manager Tab
· Select the graph to generate
· In the Benchmark dropdown window located on top of the main Reports screen, scroll down the market index list and highlight Custom Benchmark to activate the one just created. Any graphs selected under the Single Manager tab will now show the selected product versus the custom benchmark created.
This function allows you to add your current graph or report as displayed on the screen to your current proposal. Once added, you can continue with one of the following:
· To change the order of the profiles and graphs selected, highlight the report that you want to change from the Compile window and use the Up and Down arrow buttons to the right of the list to re-arrange the order.
· Click on the Add More button if you want to continue adding graphs or reports to your current proposal
· To delete any of the selected profiles or graphs, highlight the profile or graph and click on the Delete Highlighted button
· Click on the Compile button to preview the proposal
· Click on the Save (floppy disk) icon at the top of the PDF window to save the final proposal to a PDF file.
· Select file name and where to save the file and click on the Save button to continue.
· Click on the Print icon to the right of the Save icon to print the current proposal
Note: The Add to Proposal function allows you to compile graphs and reports “on the fly”. The proposal will not be saved in PSN. If you would like the system to save your presentations, use the Batch Reports function located on the main tool bar.
· Click Import Logo located on top of the main Reports screen
· Click the Browse button to locate the logo file to import.
Acceptable Logo File Format:
Only JPG and GIF formats
Maximum file size is 200K
Indexed 256-Colors (8 bit)
Maximum amount of 128 colors in color table
No compressions including LZW compression
100 x 50 pixels is recommended
· Click the Upload button
· You can use the Logo Attributes to specify logo size and placement
Note: The No Logo button allows you to view a report without a logo. To bring back the PSN logo, click onto the PSN Logo button. This button does not appear if PSN logo is the current default.
For selected graph only. Click on this function if you want to specify your preferred color for each observation plotted on a report or graph. To modify the color, click on the color box for the one you want to change. Select the new color from this grid and click on the Graph button to continue.
The Import Reports function allows you to upload reports from an external source. Available file format to import: Adobe PDF, Microsoft Word, Excel, PowerPoint and Text file. Once uploaded into PSN, it is saved as a template. The uploaded template can now be used in the Batch Report area to create presentation or the Add to Proposal function. How to import an external report:
· Click Import Reports located on top of the Reports screen
· Click the Import New Report button
· Enter the name in the Report Name box
· Click the Upload button
· Click on Save button
· Click the Browse button
· Locate the report file to import and click Open button
· Click the Upload button
· The external report is now listed as a template in the User Uploaded Reports tab
Allows you to quickly change any default graph settings or to roll the system ending date to selected ending date.
The Custom Name function allows you to re-label the names of the products as shown by default in the graph legend. Enter the new name under the Custom Description box for each product. Click the Graph button to generate to output. This function is used “on the fly”. This will not be saved in the template.
Save Template
The Save Template button will save the modified graph or report as a private template for later retrieval. The saved template will be listed under the Private Templates tab.
Delete Template
Click on this button if you want to delete one or more previously saved report templates.
Export
The Export button will export the current graph and report to an external working environment. These include: MS Power Point, MS Word, MS Excel, Windows Metafile and Adobe Acrobat. To export this report or graph, choose the environment that you want. Click on the Download button to continue. You will be prompted to save or to open to file.
Report Writer
The Report Writer function (available in the Platinum Version) is located in the Reports area under the Multiple Managers tab. This function allows the user to create a custom report in a column format to export to Excel. The user has the option to select data fields from the following categories:
Firm Information
Firm level information including location, type, legal structure, year founded, percentage owned by employees, total assets under management, tax-exempt and taxable assets, non-US assets, ownership, minority owned and firm ownership break-down.
Product Information
Product level information including database and asset class, investment styles, market capitalization, decision making process, fixed maturity, fixed duration, AIMR-PPS/GIPS compliant, open for investment, offered as mutual/commingled fund, offered as wrap/tamp program, performance incentive fee, manager tenure, manager designated benchmark and wrap sponsor.
Performance
Performance information including Product Performance Benchmark, Compliance Classification, Equal or Dollar Weighted, Verification Firm, and calculated statistics
How to Create a Report using the Report Writer:
· To generate a report for selected products, at the Selection screen, located and select the products before proceeding to the Reports/Report Writer area
· To generate a report for a PSN Universe or User Created Universe, at the Selection screen, select ANY product before proceeding to the Reports/Report Writer area. When you are running a report on a universe, they system will generate the report output quicker if you load the universe in the Report Writer area (the Universe option is available to select a universe).
· When you select the Report Writer, a system default report will appear. To re-select the data columns on the report, click the Modify button at the bottom of the screen.
· The Report Writer screen will appear. Available functions on the tool bar:
Column Selection
The Column Selection screen contains the data fields available to select. The data fields are categorized by Firm Information, Product Information and Performance.
Format Columns
The Format Columns screen lists all selected data fields to be generated on the report
Header and Footer
You have the option to customized 4 lines of headings or 3 lines of Footnotes. Click on this option if you want to change current default headings and/or footnotes for the graph. Use the macros (Firm Name, Product Name, Latest Date, etc.) provided whenever you can. This practice is more efficient since the system will reflect changes based on the macro used.
Fonts
The Fonts screen allows you to change general font type, font size, case, style and color settings for the graph.
Universe
The Universe screen allows the user to select a universe to run the report. Available Universe categories are listed under the Universe Option. They include the PSN Published Universes or select a saved universe created by the user located in the Non-Published Universes category.
· Select Format Columns located on the top of the screen
· Highlight the default field(s) to delete and click Delete Item button at the bottom of the screen
· Click the Delete All button to delete all the default fields
· Select Column Selection located on top of the screen
· Choose the desired data fields located in the Firm Information, Product information and Performance tabs
· Under the Performance tab, if you are selecting statistics:
· Choose the desired statistic(s)
· The Date Range box will appear
· Select the desired date(s)
Dates
· Click this option if you want to change the dates. Select from the Type of Date Range drop down window. Available macro dates: Latest Qtr, Year to Date, 1, 2, 3, 4, 5, 6, 7, 8, 9, 10 and Since Inception (relative only for the first selected product). The macro dates will roll to the next quarter ending automatically when you save the graph.
· To enter your own custom dates, use the Date Range boxes to enter the beginning date and ending date. The custom date ranges entered by the user will not roll to the next quarter automatically. The dates have to be updated manually.
· You have the option to select the Period Type: Quarterly or Monthly calculation. The system defaults to Quarterly
· You have the option to set up rolling date periods. For example, to setup up 8 Calendar Year Periods: In the Date Range boxes type in the most current Calendar Year: 12/2006 – 12/2007. For the #of Rolling Periods drop down window, select 7. For the #of Trailing Months drop down box, select 12. Click the Add Rolling Periods button. They system will set up the following calendar years:
12/2006 - 12/2007
12/2005 - 12/2006
12/2004 - 12/2005
12/2003 - 12/2004
12/2002 - 12/2003
12/2001 - 12/2002
12/2000 - 12/2001
12/1999 - 12/2000
· If you are generating the report for the selected products, click the View Report button at the bottom of the screen
· If you are running the report for a PSN universe or User Created Universe, select Universe located on top of the screen. Under Universe Option, select the desired universe and click on the View Report button
Note: If you are running the report for a universe and want the system to generate the summarization (High, First Quartile, Median, Third Quartile, Low, Mean, Count and Sum) for each selected column, go to Format Columns, highlight the data field to summarize (from the selected data fields listed on the left side of the screen), locate Column on the right side of the screen. Under Column, select Summarize. Repeat as needed.
· Once the report is generated to view on the screen (in a PDF output format), if you want to export the report to Excel, click the Export button at the bottom of the screen.
· If you want to re-use this report again, click the Save Template button. The saved report template will be listed under the Private Templates tab.
The Statistics Writer allows the user to create a calculated statistical report to export to Excel.
How to create a report using the Statistics Writer:
· To generate a report for selected products, at the Selection screen, located and select the products before proceeding to the Reports/ Statistics Writer area
· To generate a report for a PSN Universe or User Created Universe at the Selection screen, select ANY product before proceeding to the Reports/ Statistics Writer area. When you are running a report on a universe, they system will generate the report output quicker if you load the universe in the / Statistics Writer area (the Universe option is available to select a universe).
· When you select the Statistics Writer, a system default report will appear. To re-select the data columns on the report, click the Modify button at the bottom of the screen.
· The Statistics Writer screen will appear. Available functions on the tool bar:
Column Selection
The Column Selection screen contains the available statistics to select.
Format Columns
The Format Columns screen lists all the statistics available to select
Header and Footer
You have the option to customized 4 lines of headings or 3 lines of Footnotes. Click on this option if you want to change current default headings and/or footnotes for the graph. Use the macros (Firm Name, Product Name, Latest Date, etc.) provided whenever you can. This practice is more efficient since the system will reflect changes based on the macro used.
Universe
The Universe screen allows the user to select a universe to run the report. Available Universe categories are listed under the Universe Option. They include the PSN Publish Universes or select a saved universe created by the user located in the Non-Published Universes category.
· Select Format Columns locate on top of the screen
· Highlight the default field(s) to delete and click Delete Item button at the bottom of the screen
· Click the Delete All button to delete all the default fields
· Select Column Selection located on top of the screen
· Choose the desired statistic(s)
· The Date Range box will appear
· Select the desired date(s):
Dates
· Click this option if you want to change the dates. Select from the Type of Date Range drop down window. Available macro dates: Latest Qtr, Year to Date, 1, 2, 3, 4, 5, 6, 7, 8, 9, 10 and Since Inception (relative only for the first selected product). The macro dates will roll to the next quarter ending automatically when you save the graph.
· To enter your own custom dates, use the Date Range boxes to enter the beginning date and ending date. The custom date ranges entered by the user will not roll to the next quarter automatically. The dates have to be updated manually.
· You have the option to select the Period Type: Quarterly or Monthly calculation. The system defaults to Quarterly
· You have the option to set up rolling date periods. For example, to setup up 8 Calendar Year Periods: In the Date Range boxes type in the most current Calendar Year: 12/2004 – 12/2005. For the #of Rolling Periods drop down window, select 7. For the #of Trailing Months drop down box, select 12. Click the Add Rolling Periods button. They system will set up the following calendar years:
12/2004 - 12/2005
12/2003 - 12/2004
12/2002 - 12/2003
12/2001 - 12/2002
12/2000 - 12/2001
12/1999 - 12/2000
12/1998 - 12/1999
12/1997 - 12/1998
· If you are generating the report for the selected products, click the View Report button at the bottom of the screen.
· If you are running the report for a PSN universe or User Created Universe, select Universe located on top of the screen. Under Universe Option, select the desired universe and click the View Report button.
Note: If you are running the report for a universe and want the system to generate the summarization (High, First Quartile, Median, Third Quartile, Low, Mean, Count and Sum) for each selected column, go to Format Columns, highlight the data field to summarized (from the selected data fields listed on the left side of the screen), locate Column on the right side of the screen. Under Column, select Summarize. Repeat as needed.
· Once the report is generated to view on the screen, if you want to export the report to Excel, click the Export button at the bottom of the screen.
· If you want to re-use this report again, click the Save Template button. The saved report template will be listed under the Private Templates tab.
By default, the Return Based Style Analysis information in PSN is available only for PSN Products. It remains static until the next monthly update. Also, the style categories cannot be changed.
In contrast, the Dynamic Style function allows the user to:
· Create custom style category models by re-selecting the benchmarks and generating the information via Style Analysis graphs.
· Generate Return Based Style Analysis on Self-Entered Products, Hybrids and Mutual Funds
· Generate style information using less than 5 years historical: 20 rolling periods on a monthly basis.
How to Create a Custom Style Model:
· Click Setup located at the Selection screen on the main toolbar
· Select Styles (located on the right side of the tool bar). The Style Models Directory will appear
· Click Create New Model button at the bottom of the screen
· Enter the Name and Description
· Under Select Index, select the desired risk indexes using the drop down button
· You have the option to rename the risk index. Under Custom Name, enter the new name for each risk index
· Click Save button at the bottom of the screen
How to Activate the Custom Style Model in the Style Analysis Graphs:
Available Style Analysis graphs:
Style Quadrant
Style Allocation History
Style Summary
To Activate the Custom Style Model:
· Select the product(s) at the Selection screen
Note: You can select PSN products, Self-Entered Products, Hybrids or Mutual Funds
· Click Reports on the main tool bar
· If you select more than one
product, under the Multiple Managers tab (select up to 30
products), the available graph is the Style Quadrant graph to compare
the products together
· If you select one product and want to do manager versus benchmark comparison, under Single Manager tab, available graphs are the Style Quadrant, Style Allocation History or Style Summary graphs.
· The default graph will appear. Click the Modify button at the bottom of the page
· Select Styles on the tool bar
· You have the option to select Period Type: Quarterly or Monthly. The system defaults to Quarterly
· For the Style Quadrant Graph, you have the option to select what to show: Summary, History or Both
· Select Dynamic for Choose how to Run Style
· Locate your custom style model in the Style Model drop down box
Note: The appropriate custom model(s) created by the user will appear for the selected graph. For example, the Style Quadrant graph can accommodate 4 factors (risk indexes) per style model and 8 factors (risk indexes) per model for balanced products. The Style Allocation History graph can accommodate up to 11 factors (risk indexes) per model.
The Batch Reports function allows the user to create, edit and save presentations. The user is able to select saved graph / report templates and profiles to create a presentation.
At the Selection screen, locate and select your products
Select Batch Reports on the main toolbar
Click the New Presentation button
Type in the name of your presentation
Select Presentation Type: Multiple Replacement or Single Replacement.
Multiple Replacement- Select this option if you want to create a presentation that will enable you to make multiple replacements at run time:
· Select one or more product(s)
· The entire presentation will be produced with your entire product list
· When a MULTIPLE TEMPLATE is encountered, ALL OBSERVATIONS of the template will be replaced with your entire selected product list
· When a SINGLE TEMPLATE is encountered, replacement will be ONE PRODUCT AT A TIME UNTIL YOUR ENTIRE SELECTION IS EXHAUSTED for that template
· There will be only one PDF presentation file produced with this option
Note: # of pages = # of multiple templates + (# of products * # single template)
Single Replacement- Select this option if you want to create a presentation that will enable you to do the following at run time:
· Select one or more product(s)
· Produce the selected presentation by plotting the FIRST OBSERVATION of each template with a product from your selected product list
· Replacement will be ONE PRODUCT AT A TIME UNTIL YOUR ENTIRE SELECTION IS EXHAUSTED.
Note: # of pages = # of templates * # of products you have selected to run the batch production
· Click on the Save button
· The Templates screen will appear. Select the graphs and report templates that you would like to add to your presentation
· Double click on the left to add your graph/report selection or highlight graph/report selection and click on Add Template
· You can modify the following options on the Batch Reports toolbar. You can either keep or replace all of the following selections.
· If your selection is to KEEP, then the batch production process will use all defaults for this category as previously saved in each template. If your selection is to REPLACE, then the batch production process will use all replacement values as modified under this tab. Make the appropriate changes by specifying your criteria and clicking on Replace or just simply click on another tab to continue with setting up your presentation.
This function allows you to modify the date setting for the entire presentation. Choose from the available date ranges or type in your own custom date range.
This function allows you to modify the benchmark setting for the entire presentation. Choose the appropriate replacement benchmark from the available options.
This function allows you to modify the footnote setting for the entire presentation. Choose from the available Macro’s or type in the information.
This function allows you to modify the universe setting for the entire presentation. Choose the appropriate Universe by opening the various categories and clicking on the appropriate Universe.
This function allows you to modify the font setting for the entire presentation. Choose the appropriate fonts.
This function allows you to change the graph dimensions to 2D or from color to black and white.
This function allows you to modify the color setting for the entire presentation. Click the Key color and select a color.
· This function allows you to number the pages or add custom text in the presentation. If your selection is to Apply, then the batch production process will stamp every page with the settings. Choose from the available macros or type in the information.
· Click the Save button if you want to save the setup of the current presentation. This is highly recommended before starting the production process.
· Click the Start Production button to continue. Confirm the production process by clicking on the Start Production button again.
· Select an output format. Choose either PDF or Microsoft PowerPoint.
View: User has the option to click on the name of each graph/report that you want to see as the presentation is being produced. Note: you may proceed to other areas of the software as the final presentation is being generated by minimizing this screen.
Presentation is ready: View final results, the entire contents of the presentation will be in one file.
Report Designer allows the user to design their own unique report templates by combining data, graphs, text and images. Features include drag and drop, resizing and menus to customize both individual sections of the report, or to set parameters for the entire report. Report templates can be reused and modified to meet your changing needs.
With Report Designer, you can:
· Create fact sheets that can be used for multiple managers and are instantly updated each quarter
· Design side by side comparisons of firms and products
· Edit Firm and Product narratives
· Add your own text, logos or images
· Set all dates for each graph in the report using one menu
· Use your own self-entered portfolios in the design page
· Add the finished template to your batch reporting process
How to Create a Custom Template Using the Report Designer:
· Open PSN Enterprise
· At the Selection screen, select your products and/or market indexes using the Data Set drop down window. Use the Locate box to search for a specific manager/product name (Note: most PSN graphs allow a maximum of eight observations)
· Click Report Designer on the main tool bar
· Click Create New Presentation button at the bottom right of your screen
· Type the name of your presentation
· Select Presentation Type. Multiple Managers is used to place more than one observation in the legend of the graph. Most PSN graphs allow a maximum of eight observations. Single Manager is used to place one observation in the legend of the graph including the PSN assigned default benchmark. When finished, click the Save button.
The Report Designer screen will appear with the following functions:
Presentation Directory
Select this function to view/retrieve/edit your saved Report Designer presentation
Object Directory
Select this function to view/retrieve/edit your saved formatted objects
Modify all objects or certain objects in the presentation using the following tools: Dates, Benchmarks, Universe, Fonts, Options, Colors, Symbols, Page, Observations, Blend(s).
Modify Object
Modify the selected object using the following tools: Position, Dates, Statistics, Headers & Footnotes, Options, Fonts and Observations.
Save
Save changes to presentation
Preview
Preview the design page layout with the selected objects
+Page
Add an additional page
-Page
Remove a page
Page Set-up
Select Landscape/Portrait page selection
Align (No Change, Top Sides and Left Sides)
Objects will align to the first object selected on the page. Multiple objects can be selected and aligned by holding down the Shift key on your PC while selecting objects for alignment. The target objects will then align to the primary object using the Top Sides and Left Sides options, as required.
Size
Based on the objects selected, the user can re-size the width and height of the selected objects to either Shrink to the Smallest or Grow to the Largest. The re-sizing function is always relative to the objects selected. The primary object (either largest or smallest) will determine the size of the selected target modules. Multiple objects can be selected and re-sized by holding down the Shift key on your PC while selecting objects for re-sizing.
Object Choice
To the left of the screen are available graphs, profile blocks and narrative blocks to select. The Multiple Managers tab is the system default for graphs and is used when you want to display more than one manager on a graph. Use the graphs listed in the Single Manager tab if you want to display manager versus benchmark analysis. You may also choose from Single Blended Portfolio, and Multi-Scenario tabs. Select the Profile Blocks tab to access the firm and product data blocks that exist as unique sections in our firm data and product data profiles. Select the Narrative Blocks tab to access the firm and product narrative blocks that exist as unique sections in our firm narrative and product narrative. Select the Performance Profile Blocks tab to access the graph legend blocks.
Note: Graph templates created in Reports by the user are available to use in the Report Designer under the Private Graph Templates tab. Public graph templates are also available to use in Report Designer under the Public Graph Templates tab.
Page Set Up
The default page set-up is Landscape. To change page set-up to Portrait, click on the drop down button to the right of Landscape and select Portrait.
· When you select a graph, profile block or narrative block, the item will appear on the design page layout to the right.
· To move the item, click on it and drag with your mouse to where you would like it to appear on the page.
· Click the Preview button to see the report.
· Click on Design to go back and make changes.
· To delete an object, click on the object and then your delete key.
· Objects can be aligned or resized quickly by using the Align or Size button explained earlier.
· To modify your selected item, click on it and select the Modify Object button. The Modify Object screen will appear. Select the following functions on the toolbar to modify your object:
Positions
This function is used to re-set the object position and size on the page. Click Apply button to save the change. To save this formatted function, provide a name and click on the Save Object As button. The saved object will be listed in the Object Directory on the main design page or as a Private/Shared Object on the design page. Saved object can be used again in other designs.
Dates
This function is used to re-select the desired dates (Note: the system default dates for most PSN graphs are Latest Qtr, 1, 2, 3, 5, and 10 year periods ending latest quarter). Click Apply button to save the change. To save this formatted function, provide a name and click on the Save Object As button. The saved object will be listed in the Object Directory on the main design page or as a Private/Shared Object on the design page. Saved object can be used again in other designs
Statistics
This function is used to re-select the desired statistic(s). Click Apply button to save the change. To save this formatted function, provide a name and click on the Save Object As button. The saved object will be listed in the Object Directory on the main design page or as a Private/Shared Object on the design page. Saved object can be used again in other designs
Universe
This function is used to re-select the desired universe when applicable. The universe option includes PSN Published Universes and Non-Published Universes created by the user. To save this formatted function, provide a name and click on the Save Object As button. The saved object will be listed in the Object Directory on the main design page or as a Private/Shared Object on the design page. Saved object can be used again in other designs
Headers and Footnotes
This function is used to customize the heading and footnote areas. There are four lines available for headings and three lines for footnotes. Click Apply button to save the change. To save this formatted function, provide a name and click on the Save Object As button. The saved object will be listed in the Object Directory on the main design page or as a Private/Shared Object on the design page. Saved object can be used again in other designs
Options
This function is used to re-format the look of the graph (3D format, visible legend (simple/value), vertical/horizontal titles, etc.). Click Apply button to save the change. To save this formatted function, provide a name and click on the Save Object As button. The saved object will be listed in the Object Directory on the main design page or as a Private/Shared Object on the design page. Saved object can be used again in other designs.
Fonts
This function is used to change the fonts (heading case, justification, font type/style/size) and color for the heading, footnote, legend and axis areas. Click Apply button to save the change. To save this formatted function, provide a name and click on the Save Object As button. The saved object will be listed in the Object Directory on the main design page or as a Private/Shared Object on the design page. Saved object can be used again in other designs.
Observations
This function is used to re-arrange the order of appearance for the selected products and/or market indexes in the legend of the graph object. Most PSN graphs allow a maximum of eight observations. The maximum eight products are represented by the term Key #1, Key #2, Key #3, Key #4, Key #5, Key #6, Key #7 and Key #8. The system default benchmarks for the eight products are represented by the term Default Benchmark for Key #1, Default Benchmark for Key #2, Default Benchmark for Key #3, Default Benchmark for Key #4, Default Benchmark for Key #5, Default Benchmark for Key #6, Default Benchmark for Key #7 and Default Benchmark for Key #8.
If the object is a narrative, you may edit the narrative here. Click Apply button to save the change. To save this formatted function, provide a name and click on the Save Object As button. The saved object will be listed in the Object Directory on the main design page or as a Private/Shared Object on the design page. Saved objects can be used again in other designs
Design
· After applying the changes, click on Design to go back to the design page layout screen.
· At the design page layout screen, Click on the Save button to save all your changes to the presentation.
· The Report Designer saved presentations are now available to compile using the Batch Reports function on the PSN main toolbar.
Modify Presentation
To modify all objects or certain objects in the presentation, click on the Modify Presentation button. The Modify Presentation screen will appear. Modify Presentation has similar functions as Modify Objects except it will affect the entire presentation.
Understanding the Report Designer Layout Grid
To situate objects on the report designer grid the user can ‘eyeball’ the location of a given module and place it on the page. To refine the position and size of the object, use the MODIFY OBJECT selection from the toolbar. This will access numerical information based on the X/Y Axis of the grid. X/Y information appears in the lower left corner of the main Design page.
Object Position
The upper left corner of the design page grid reflects the lowest numerical quantity for the X/Y Axis; essentially 0/0. As you move the cursor toward the lower right corner of the grid the X/Y numbers increase proportionately until they reach their maximum in the far right bottom corner.
The object position coordinates are determined by the positioning on the grid of the upper left corner of each selected object. Place the 4 arrow cursor at this point to determine these values while noting the X/Y information at the base of the page. This point equates with the numerical values you see in Object Position: Left and Top.
Object Size
The user can re-size a selected object by reassigning the values in the Width/Height fields. The original values can be increased or decreased, as required, to alter the size of a specific object. This function is very useful if you want your objects to be identical in size. For example, if you want 2 selected modules to have identical widths and heights, and the original module dimensions are 300 x 200, you can input the same values for your new object and it will match the dimensions of the primary object.
This function is used to view/retrieve/edit your saved formatted objects. It is also used to create a new Text or Image object.
To Create a Text Object: (heading, comments, footnotes)
· Select Object Directory
· Click on Create New Object at the bottom right of your screen
· Type in the name of your object
· Click on the drop down button to the right of the Object Type window
· Select Text to add custom text, select Macro Text to also use the System default macro fields (Firm Name, Firm Abbrev, Product Name, Product Abbrev, and Today’s Date) or select Key Macro Text to add a custom text to a select observation(s).
Note: If you select to create a Macro Text Object, along with the option to add basic macro fields (firm name, product name, etc.), you can also select the field’s macro button to access data fields from Firm Information, Product Information and Performance categories.
· Click on the Save button
· The next screen allows you to add your text, re-select the font style/type/size and the position of the object.
· Click on the Save Object button to save your object. This text object is now available for your use and is listed under your Private/Shared Objects tab.
To Create an Image Object: (logo, picture)
· Select Object Directory
· Click on Create New Object button
· Type in the name of your object
· Click on the drop down button to the right of the Object Type window and select Image
· Click on the Save button
· The next screen allows you to upload an image and re-select the position of the object
· Click on the Save Object button to save your object. This image object is now available for your use and is listed under your Private/Shared Image Objects tab.
To retrieve a saved Object:
· Select Object Directory
· Under Object Name column, click on the name of a saved object
· The object editing screen will appear
To retrieve a saved Report Designer presentation:
· Open PSN Enterprise
· At the Selection screen, use the Locate box to locate and select your observation(s)
· On the main tool bar, select Report Designer
· The Presentation Directory screen will appear
· Under Presentation Name column, click on the name of a saved presentation
· The design layout screen will appear for you to preview the presentation or to edit
The Setup screen contains available system wide settings. The user has the option to change settings for current session or permanently. All changes are applied system wide.
System Ending Date
User can select an ending date different than the default system ending date for reports and graphs. Input ending month or quarter you require for your output.
Ending Date in the macros will be the system ending date. Default period type will be monthly. - Choose this option to create output with monthly intervals.
Ending Date in the macros will be the last ending quarter month i.e. 3, 6, 9 or 12. Default period type will be quarterly. – Select this option to generate output with quarterly intervals.
Note: The System Ending Date can be changed for Current Session only
Hybrid System Settings
Default Mixing Mode
User can select system-wide instructions for system to handle hybrid members with no ROR for a given period.
Custom Benchmark
Users can now choose to Build Custom Benchmark While Building the Hybrid and apply this option permanently from the Setup menu.
Simulated and prior firm returns settings:
Give you the option to ignore all products that check YES as having simulated data. Give you the option to ignore all products that check YES to have data from a prior firm.
Default Currency
PSN can now translate product and firm data, including asset values, minimum account size and fees as well as returns, into 23 different global currencies. Currency calculations can be applied to over 30 years of data, simply by clicking on Set Up>System in the blue main toll bar and changing the default currency in the drop down available. After changing the currency (for the current session or permanently) all graphs and output will appear in the new base currency.
Miscellaneous
Show Active Only
Output includes products and managers actively participating in the PSN database.
Keep Market Indexes at the bottom of selection
Check this option to always keep benchmarks at the bottom of the graph’s legend.
Multiple Manager Settings
Include Benchmark as a key to 'Multiple Managers' graphs - Selecting this option will place your benchmark in the body of the graph. It will also appear in the legend of the graph and set it as a key or intersection point when utilizing 4 quadrant graphs. If you select a graph that uses the benchmark as a computational reference point, it will NOT appear as an individual member of the output.
Single Manager Settings
Include Benchmark as a key to 'Single Manager' graphs - Selecting this option will place your benchmark in the body of the graph. It will also appear in the legend of the graph and set it as a key or intersection point when utilizing 4 quadrant graphs. If you select a graph that uses the benchmark as a computational reference point, it will NOT appear as an individual member of the output.
Single Blended Portfolio
Include Benchmark as a key to 'Single Blended Portfolio' graphs - Selecting this option will place your benchmark in the body of the graph. It will also appear in the legend of the graph and set it as a key or intersection point when utilizing 4 quadrant graphs. If you select a graph that uses the benchmark as a computational reference point, it will NOT appear as an individual member of the output.
Include Single Managers as keys to 'Single Blended Portfolio' graphs - Selecting this option will include the individual members of the Blend in the body of the graph and in the legend.
Generate second page with blend allocation - If you want your output to include the allocation, in percentage terms, of your Blend - check this box. A second page will be generated displaying this information.
Remove blend members with 0 percent from the legend – If a member of your hybrid has 0% allocation, it will not appear in the blend allocation legend.
Multiple Scenarios
Include Benchmark as a key to 'Multiple Scenarios' graphs. – See explanation above.
Include Single Managers as keys to 'Multiple Scenarios' graphs. - Selecting this option will include the individual members of the Blend in the body of the graph and in the legend.
Generate second page with blend(s) allocation. - If you want your output to include the allocation of your Blend in percentage terms, check this box. A second page will be generated displaying this information.
Remove blend members with 0 percent from the legend - If a member of your hybrid has 0% allocation it will not appear in the blend allocation legend.
User’s color choices are saved between graphs and between sessions. When running a report, users can select different colors for their observations. These color choices are stored in the database so the next time the user logs in, he/she does not have to re-select the scheme again.
The option allows the user to re-enter 4 lines of headers and 3 lines of footnotes for graphs and reports. This can be saved for the current session or applied permanently.
The option allows the user to re-set the font for the following: Heading Font, Footnote Font, Axis Font and Legend Font. This can be saved for current session or applied permanently.
The user has the option to re-organize the private templates into different folders.
This function allows the user to create custom Style (Return Based Style Analysis) Models to be used in the Style Graphs with the Dynamic Style function activated. The user can select the desired risk indexes to represent the user defined style categories.
Introducing Presentation Designer, a New Reporting Tool for PSN Enterprise
We are very excited to introduce Presentation Designer, a very user friendly & intuitive reporting tool for PSN. Presentation Designer allows user to quickly craft a customized presentation; saving time and automating the report process for future use.
We are very excited to introduce Presentation Designer, a very user friendly & intuitive reporting tool for PSN. Presentation Designer allows user to quickly craft a customized presentation; saving time and automating the report process for future use.
Features |
Benefits |
User Interface |
Very user friendly and intuitive |
Presentation View Window |
Ability to view (on the screen) individual pages along with selected report objects while designing presentation; no need to preview |
Edit Layout |
Ability to easily slice the page area into spaces for graph and text objects placement |
Add Objects |
Ability to easily select graph and text objects and dropping them to page template |
Object - Properties |
Ability to right click to edit object properties on page layout: dates, statistics, headings/footnotes, Options and Fonts |
Data Properties |
Ability to re-select products and benchmarks (or other product types: self-entered and hybrids) within Presentation Designer; no need to navigate away from Presentation Designer screen |
Download as PDF |
Ability to preview selected page or entire presentation via PDF output |
Library |
Ability to create folders to organize presentations, page templates and report objects for easy access |
Clone Presentations |
Ability to easily clone presentations |
Share Presentations and Page Templates with other PSN Users |
Ability to easily share presentations and page templates with other PSN users. Thus, organizing work process or controlling the flow of information. |
Getting Started:
· Open PSN Enterprise to the Selection screen
· Use the Data Set window to bring up the product category (i.e. Product – Gross of Fees, Market Indices, Self-Entered and Hybrids)
· Use the Locate window to search for selected products
· Select (check) the product(s)
· Select Presentation Designer on the main tool bar (highlighted; to the far right of tool bar):
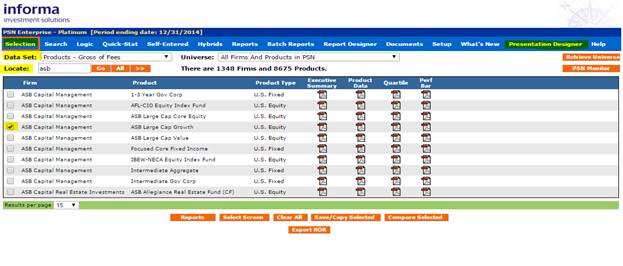
· Presentations screen will appear
· Locate Create a new presentation window and enter name of new presentation. Also select presentation type: Multiple Managers (default) or Single Manager (focused on selected manager vs. comparison benchmark)
· Click Create button:
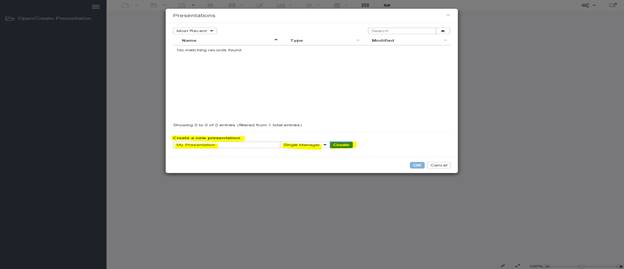
The
Presentation View window will appear. The Presentation
Designer Tool Bar is above the window area:
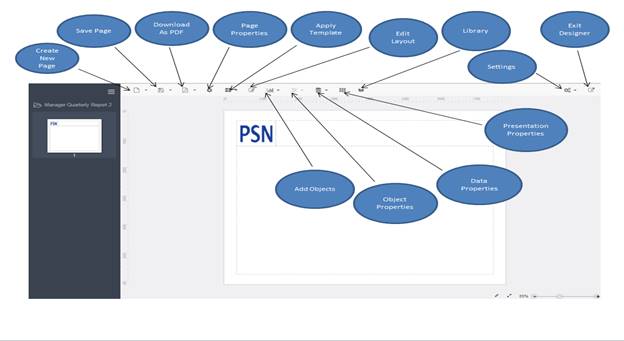
Presentation Designer - Tool Bar Definitions:
Create New Page - Create new page template to start designing
Save Page – Save all changes to current page template
Download As PDF – View current page template or entire presentation via PDF output
Page Properties – Select page mode: Landscape or Portrait, add page border, background color and edit page margins
Apply Template – Allows users to access saved templates and add to current page template
Edit Layout – Edit layout spaces on page template for object placement
Add Objects – Add report objects (i.e. graph objects, macro text objects, narrative text objects) to page template
Object Properties – Edit object properties such as: dates, statistics, headings/footnotes and fonts
Data Properties- Re-select product(s) and benchmark to display in presentation
Presentation Properties – Edit changes to a report object and apply to all report objects or selected
report objects in presentation
Library – Allows user to create folders to organize saved presentations, page templates and report objects
Setting - Select Rendering Quality: Low (default) or High (very CPU and memory intensive). Also, option to display grid on page template.
Exit Designer – Exit Presentation Designer and back to PSN Enterprise / Selection screen
· Click Create New Page; see screenshot below. A new page template will appear:
Create New Pageicon (highlighted)

· Click Page Properties to select page mode: Landscape (default) or Portrait, set page margins, border styles/width/color and background color:
Page Propertiesicon (highlighted)

Page Propertiesoptions
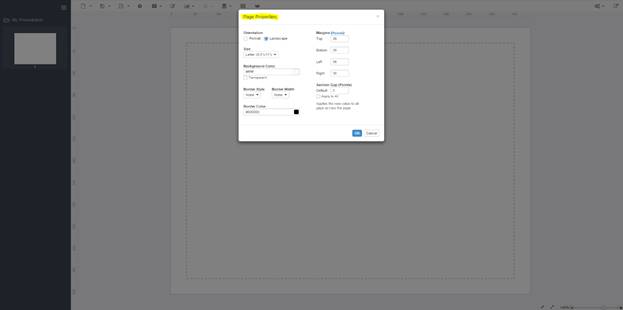
· Click on Edit Layout to start designing spaces on the page template for report object(s) placement:
Edit Layouticon (highlighted)

Use mouse to slice the page template into spaces for report object(s) placement. Right click on mouse to move line to Left, Right, Grow, Shrink or Delete:
Here is an example of selecting “grow” to expand the line spacing:
· Click Add Object to locate and select report object(s) to place on page template:
Add Objecticon (highlighted)

· Select report object category (i.e. Multiple Managers, Single Manager). Enter object name in the Search objects window; hit enter on keyboard:
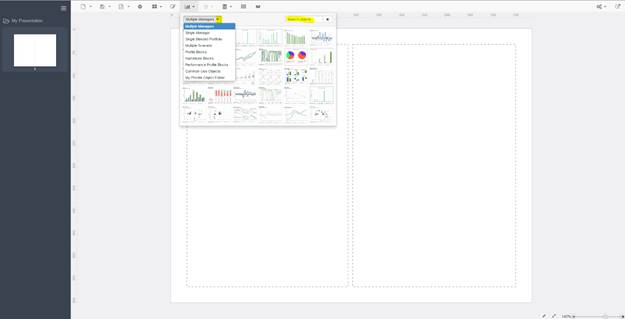
· Click Add to Page button to add object to page template (Note: report object will be placed on page in available spaces from left to right); or use mouse to drag object out and drop to desired space on page:
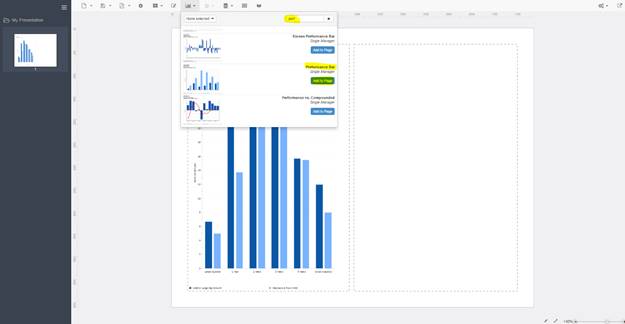
· Repeat same steps to add additional report object(s):
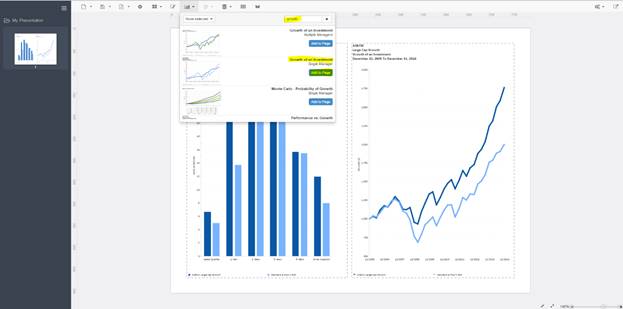
· To edit report object, click object on page, right click and select Properties:
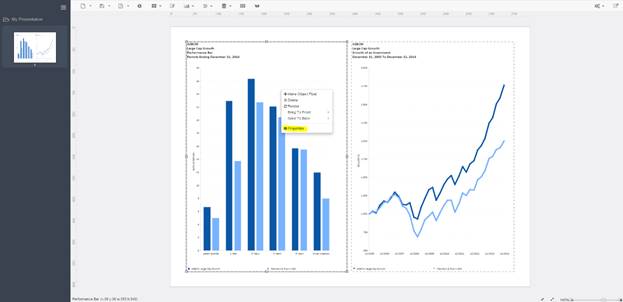
· Available to edit under Properties: Dates, Statistics, Headers & Footnotes, Options, Fonts and Observations.
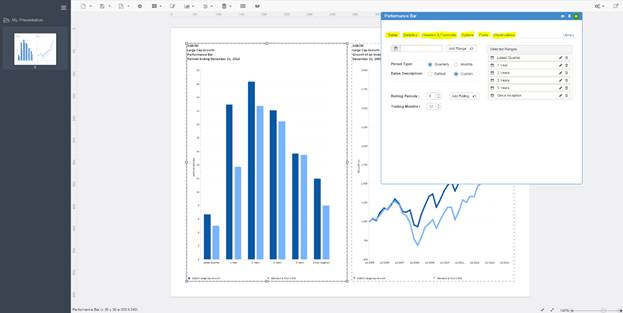
· NOTE: Options give user wide range flexibility to edit object’s General Appearance, Symbols and Lines, Legend, Axis, Texts and Descriptions:
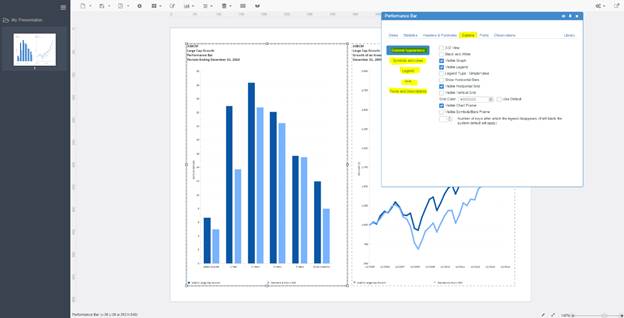
· Click x to save changes and exit Properties. Repeat steps to edit other report object(s) on page template.
· Alternatively, instead of right click on mouse to select Properties, user can click the report object on page template to edit and select Object Properties icon / Advanced (highlighted):
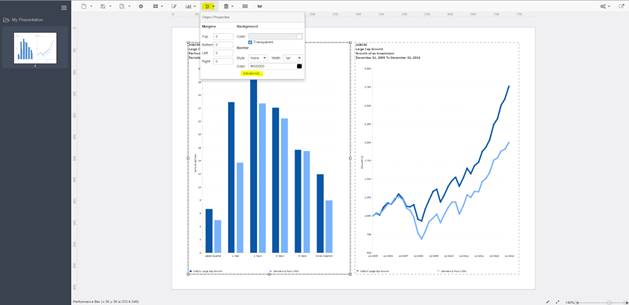
Presentation Designer Reference Guide
· Below is an example of a finished page template. The following were changed in Object Properties:
Change look from 2-D to 3-D, reselected dates: Latest, 1, 3 and 5, update headings for both objects, Performance Bar: remove vertical and horizontal lines, change legend font size. Growth of Investment: remove legend and remove vertical lines. Click Save Page icon (highlighted) to save changes to current page template:

· NOTE: For wide screen monitor, right click on selected object, select Properties. The Properties menu can be visible to the left of the screen by clicking Toggle dock mode (circled in red, next to x). This will allow user to edit object using Properties menu and see changes to page template at same time:
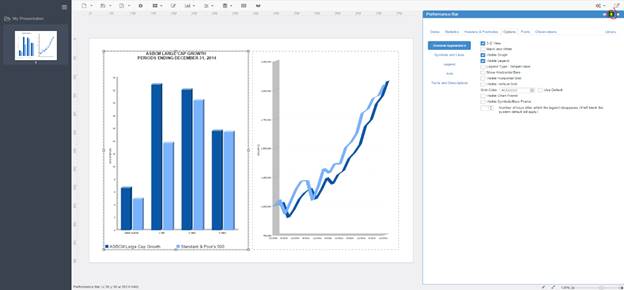
· To add another page template, click Create New Page (highlighted) and repeat previous steps to design new page:
Here is an example of additional page templates added to current presentation. To view presentation as PDF output, click Download as PDF icon / select down arrow and Download Presentation as PDF (highlighted):
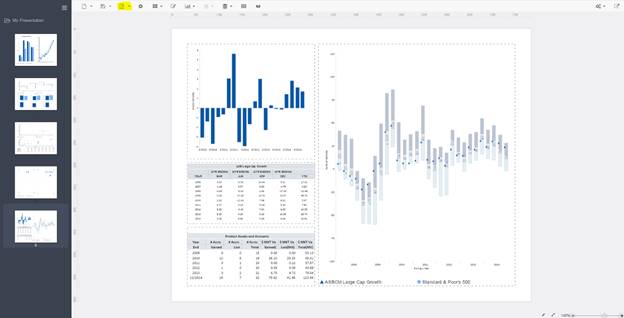
User Information can be shared among PSN users from the same firm and the users have to be grouped by PSN to a department name (i.e. Marketing, Research, Sales, Consultant Group, etc.).
Users can be grouped to more than one department. The owner/originator (of the shared information) is the only one who can edit and update the shared information.
The following User Information can be shared:
· When the user creates a graph or report and clicks the Save Template button, the user can:
· Save the template to appear under the user’s Private Templates tab and at the same time, under Share Your Work, select the department(s) listed to share under Groups Visible to you for Distribution
· The shared template will be listed under the Public tab (in Reports area) for other users (in the department) to use
· The shared template cannot be altered. Only the owner can edit and update the shared template.
· Universes and custom Universe can be shared. To share a saved universe(s) or custom universe (s):
· At the Selection screen, click the Retrieve Universes button
· Select Universe Directory
· Select the universe(s) and custom universe(s) to share by placing a checkmark inside the square box located to the right side of each universe and custom universe. Note: To select all universes and custom universes to share, click the Select All button at the bottom of the screen.
· Click the Share Selected button at the bottom of the screen
· Under Share Your Work, select the department(s) listed to share underGroups Visible to you for Distribution
· Click the Share button
The other users in the department can select any products in the shared universe or custom universe to create a graph or report by going to the Universe drop down window at the Selection screen and selecting the shared universe or custom set from the listing.
The shared universes or custom universes cannot be altered. Only the owner can edit and update them.
Note: When the user saves a universe or custom universe for the first time by clicking the Save Universe button, Save Current Universe button or Query and Keep Results as Universe button, the user can:
Save the universe or custom universe to appear under the user’s Universe Directory (under the Retrieve Universe button) and at the same time, under Share Your Work, select the department listed to share under Groups Visible to you for Distribution.
The shared universe or custom universe will be listed under the Universe drop down box at the Selection screen. The other users in the department can retrieve the shared universe or custom universe and use any products listed to create a graph or report.
The shared universe or custom universe cannot be altered. Only the owner can edit and update the shared universe or custom universe.
Hybrids created by the user can be shared. To share a hybrid(s):
· Select Hybrids on the main tool bar
· Select Hybrids Directory
· Select the hybrid(s) to share by placing a checkmark inside the square box located to the right side of each hybrid. Note: To select all hybrids to share, click the Select All button at the bottom of the screen.
· Click the Share Selected button at the bottom of the screen
· Under Share Your Work, select the department listed to share under Groups Visible to you for Distribution
· Click the Share button
The other users in the department can select the shared hybrid(s) to create a graph or report by going to the Selection screen, in Data Set drop down window, select the Hybrids listing
The shared hybrids cannot be altered. Only the owner can edit and update them.
· Self-Entered Products created by the user can be shared. To share a self-entered product(s):
· Select Self-Entered on the main tool bar
· Select Self-Entered Directory
· Select the self-entered product(s) to share by placing a checkmark inside the square box located to the right side of each hybrid. Note: To select all self-entered products to share, click the Select All button at the bottom of the screen.
· Click the Share Selected button at the bottom of the screen
· Under Share Your Work, select the department listed to share under Groups Visible to you for Distribution
· Click the Share button
The other users in the department can select the shared self-entered product(s) to create a graph or report by going to the Selection screen, in Data Set drop down window, select the Self-Entered listing.
The shared self-entered products cannot be altered. Only the owner can edit and update them.
Batch Report Presentations created by the user can be shared. To share a presentation(s):
· Select any product at the Selection screen
· Select Batch Reports on the main tool bar
· Under Presentation Directory, select the presentation(s) to share by placing a checkmark inside the square box located to the right side of each presentation. Note: To select all presentations to share, click the Select All button at the bottom of the screen.
· Click the Share Selected button at the bottom of the screen
· Under Share Your Work, select the department listed to share under Groups Visible to you for Distribution
· Click the Share button
The other users in the department can select the shared presentation to generate the output. The shared presentation(s) will be listed under their Presentation Directory.
The shared presentation(s) cannot be altered. Only the owner can edit and update the shared presentation(s).
Report Designer Presentations created by the user can be shared. To share a presentation(s):
· Select any product at the Selection screen
· Select Report Designer on the main tool bar
· Under Presentation Directory, select the presentation(s) to share by placing a checkmark inside the square box located to the right side of each presentation. Note: To select all presentations to share, click the Select All button at the bottom of the screen.
· Click the Share Selected button at the bottom of the screen
· Under Share Your Work, select the department listed to share under Groups Visible to you for Distribution
· Click the Share button
The other users in the department can select the shared presentation to generate the output. The shared presentation(s) will be listed under the Report Designer tab in the Reports area.
The shared presentation(s) cannot be altered. Only the owner can edit and update the shared presentation(s).
Report Designer User Objects created by the user can be shared. To share a User Object(s):
· Select any product at the Selection screen
· Select Report Designer on the main tool bar
· Under Objects Directory, select the object(s) to share by placing a checkmark inside the square box located to the right side of each object. Note: To select all objects to share, click the Select All button at the bottom of the screen.
· Click the Share Selected button at the bottom of the screen
· Under Share Your Work, select the department listed to share under Groups Visible to you for Distribution
· Click the Share button
The other users in the department can select the shared object(s) to use in their own Report Designer template. The shared object(s) will be listed under the Private/Shared Objects tab when creating a Report Designer template. The shared object(s) cannot be altered. Only the owner can edit and update the shared object(s).
From SELECTION, locate and select the manager(s) you want to use
Click REPORTS on the main tool bar or at the bottom of the page
On the left side, select the graph needed
From SELECTION, locate and select the manager(s) you want to use
Click REPORTS on the main tool bar or at the bottom of the page
On the left side, select the graph needed
At the bottom of the page click the MODIFY button to change dates, headers and footer or other options listed in the tool bar
At the bottom of the page, click the GRAPH button to view your changes
Click the SAVE TEMPLATE button, name it, click SAVE button
You can find your saved temples under PRIVATE TEMPLATES tab
From SELECTION, locate and select the manager(s) you want to use
Click REPORTS on the main tool bar or at the bottom of the page
On the left side, select the graph needed
At the bottom of the page, click the EXPORT button
Select an option from the pop-up window and click DOWNLOAD
From SELECTION, locate and select the manager(s) you want to use
Click REPORTS on the main tool bar or at the bottom of the page
Click IMPORT LOGO from the tool bar menu
Click the BROWSE button to find the logo (make sure your logo is acceptable to the file format)
Click LOGO ATTRIBUTES - check your dimensions and position
At the bottom of the page click VIEW GRAPH button
Your logo will appear on all graphs except those in Uploaded Report, Public and Report Designer (Public reports you need to import logo for each graph individually)
From SELECTION, locate and select the manager(s) you want to use
Click REPORT DESIGNER on the main tool bar
Click OBJECT DIRECTORY
At the bottom of the page click CREATE NEW OBJECT
Enter NAME, select Object Type: IMAGE
Click SAVE at the bottom of the page
Select your logo size width and height (1 inch is = 72)
Click on SETTINGS in the toolbar
Change Resize rule to: IMAGE SCALE then click UPLOAD
BROWSE your directory to locate your image, then SUBMIT
Click SAVE OBJECT at the bottom of the page
Click BACK TO DIRECTORY at the bottom of the page
Click PRESENTATION DIRECTORY and select the presentation you want to add the logo to
Click PRIVATE/SHARED OBJECTS tab from the menu listing on the left
Select the logo object; the object will be placed on the layout page. Click the log object with your mouse to move to your desired space on the page
· From SELECTION, locate and select the manager(s) you want to use
· For Platinum users click on Export ROR button at the bottom of the page
· All other users go to REPORTS
· Go to Multiple manager and find Statistic Writer
· Go to Modify
· Double click Rate of Return
· Select the performance dates you want to see
· Click View Report
· Click Export at the bottom of the page
From SELECTION, locate and select the manager(s) you want to use
Click VIEW SELECT button at the bottom of the screen
Click SAVE CURRENT UNIVERSE button
Enter name and description
Click SAVE button
From SELECTION, locate and select the manager(s) you want to use
Select REPORTS on the main tool bar
Select Multiple manager tab and find Statistic Writer or Report writer
Select Modify button
Format your columns with information needed
Click View Report button
Click EXPORT button at the bottom of the page and select your format
From the main SELECTION screen use the DATA SET dropdown to select the
Products
or market indexes you wish to include in your blend.
Click HYBRIDS on the main toolbar
You are now in the OPTIONS area where you can name your blend and reallocate the default hybrid percentages
Click SAVE MIX to retain your named Hybrid and the blend member allocations as modified by the user
Click the HYBRIDS DIRECTORY button in the green toolbar to view the list of user created and saved hybrids
To update any Hybrid from your list, simply click on the Hybrid name to see its attributes – then click LOAD to work with it in the OPTIONS area
To generate a graph or report using a saved Hybrid, go to the main SELECTION screen and select HYBRIDS from the DATA SET dropdown. Check one or more of your Hybrids; click REPORTS from the main toolbar to generate graphs.
From the main SELECTION screen use the DATA SET to select the products or market indexes you wish to include in your presentation. Place a check mark next to each desired item, and then click BATCH REPORTS in the main toolbar.
Click the NEW PRESENTATION button to name your presentation and select Multiple Replacement or Single Replacement. Click Save button.
At the TEMPLATES screen, select the desired graph/report templates to add to the presentation
Use the green toolbar options to modify any aspect of your presentation across all of your selected templates
Click SAVE button to retain your Presentation name and preferences for future productions
Go to the START PRODUCTION button to compile your presentation. When this process is complete look for PRESENTATION IS READY. Click VIEW to generate the Presentation in a PDF window which can then be saved as a PDF file.
To utilize your saved presentation with a different manager selection, simply choose your new products from the main SELECTION screen and click BATCH REPORTS. This accesses the PRESENTATION DIRECTORY. Then click on the name of the production you want to run and go to START PRODUCTION.
Headers - The capability to set custom graph/report header and footnotes; once set, this header and footnote will appear on all of the graphs and reports in the program.
Select Setup on the main toolbar
On the secondary toolbar, select Headers
There are four lines of header and three lines of footnote to customize
Select either Apply for Current Session button or Apply Permanently button
Folders - Create your own folder tab in the Reports area to organize your graph and report templates.
Select Setup on the main toolbar
On the secondary toolbar, select Folders
Click on New Folder button
In the Folder Name box, type the name for your new folder
Double click on any report available on the left hand side and add them to the right hand side
Use the arrow keys on the right to move selected reports up and down as you would like them to appear in the listing
Click on Save Button
Make sure 'Use custom' checkbox is checked to apply custom folders settings
System Ending Date - The capability to generate graph/report output on Month End data ending as well as Quarter End data ending for the current session (Note: This feature will not change the Quick-Stat screen)
Select Setup on the main toolbar
On the secondary toolbar, select System Settings
Type the ending date in the System Ending Date box. For Month Ending, type for example: 1/31/2005 and check off Ending Date in the macros will be the system ending date. Default period type will be monthly. For Quarter Ending, type for example: 6/30/2004 and check off Ending Date in the macros will be the last ending quarter month i.e. 3, 6, 9 or 12. Default period type will be quarterly.
Click on Apply for Current Session button.
The capability to view Active and Inactive products within the database
Select Setup on the main toolbar
On the secondary toolbar, select System Settings
Under Miscellaneous, turn off the checkmark for Show active products only
Select either Apply for Current Session button or Apply Permanently button
Increase the number of products to view on the Selection screen
Select Set-up on the main toolbar
On the secondary toolbar, select System Settings
Under Miscellaneous, locate the Default number of products on the browser page drop-down box. Select number of products to view (Maximum number is 200)
Select either Apply for Current Session button or Apply Permanently button
Latest -View the most current returns for the products
Quick-steps:
Select Quick-Stat on the main toolbar
On the secondary toolbar, select Latest
To view the returns for a prior year, click on the date drop-down box located in the upper right hand corner of the screen
Manager Web - Quick link to the manager website to do research
Select Quick-Stat on the main toolbar
On the secondary toolbar, select Manager Web
Advance View – Export Quick-Stat View to Excel
At the Selection screen, retrieve a universe from the Universe drop-down window
Select Quick-Stat on the main toolbar
On the secondary toolbar, select Advance View
In the View drop-down window, select Quick-Stat View
Click on Export to Excel button located at the bottom of the screen
Export ROR – Export the historical returns of a universe to Excel (CSV format)
At the Selection screen, retrieve a universe from the Universe drop-down window
Click on Select Universe button located at the bottom of the screen
Click on Export ROR button located at the bottom of the screen
Select Period Type to export (Monthly or Quarterly)
Click on Export ROR to Excel button
Retrieve Universe - The capability to create merged universes into a single one
At the Selection screen, click on Retrieve Universe button
Click on Create Merged button located at the bottom of the screen
Type in the Short Abbrev and Description for the merged universe
Under the Universe Option, select the type of universe(s). From the universe listing, select the universe(s) to be merged (Double click to choose).
Click on the Save button located at the bottom of the screen
The double arrow function allows users to enter partial names to search for observations
At the main Selection screen, click on the double arrows to the right of the Locate box / Go button
The Locate options drop down box will appear
Choose to locate by selecting: Starts with, Any of the words, All of the words or exact phrase
Click on the Go button
Set-up - Option to automatically plot Benchmarks to all Multiple Managers graphs
From the green toolbar in the Reports area, select Setup
Under Multiple Manager Settings, check the box to Include Benchmark as a key to Multiple Managers' graphs
Click on the Apply button
The Benchmark drop-down window will appear. Select the appropriate benchmark to be included in the legend of the graph.
Custom Names – Re-label names of observations on graphs
From the green toolbar in the Reports area, select Custom Names
Enter the new label for each designated product on the right hand side under “Custom Description.”
Modify /Add Your Manager – Insert your manager in the legend of the graph (this feature is available for most graphs)
Click on Modify
Select Add Your Manager to the right of the tool bar. Enter the manager/product name and appropriate values
Modify/Dates – Re-label the selected dates in the Description Box
Click on Modify
Select Dates
Under the Description box (to the right of the Selected Data range(s) box), double click on the date(s) listed and type the custom date description.
Circle on the top left area of the Reports screen allows user to see the Full Screen of any graph or report they are generating.
From the Reports area, click on the open circle on the top left hand side of the screen to view the graph/report in full screen.
Adobe Select Graphic tool - Copy part of any graph or report and paste to another format such as PowerPoint, MS Word, etc.
From the main Reports area, click on the graphics select tool from the Adobe Toolbar; depending on the version of the Adobe software that you have the icon varies but there should be a perforated box around the icon.
Use your mouse to select the graph area and right click to select Copy Selected Graphic. Open an application such as Microsoft PowerPoint or Word, right click and select paste.
Performance Historical ROR by Period – Export historical return of selected product to Excel
In the Reports area, select PSN Profiles tab
Select the Historical ROR by Period report
Click on Export button at the bottom of the screen
This section contains information on PSN return-based styles analysis available via PSN Enterprise. Based on your level of PSN Enterprise subscription, some of them may not be available to you. Please contact Informa Investment Solutions client services at clientservices@informais.comfor further details.
The PSN Style Analysis module examines how much of a product’s return is attributable to the manager’s investment style and how much is attributable to the manager’s skill in selecting securities. The module provides quick insights into a products current and historical style consistency. The module also evaluates the selection skill of the manager by comparing the manager’s actual return to the returns associated with a representative style index. Our model is based on William F. Sharpe’s theories.
PSN Style Analysis offers both static and dynamic reporting functions. In dynamic reports the user has the option to change the associated indices and time periods. In static reports, the indices used are listed below.
US EQUITY |
|
Style Category |
Representative Index |
Large Cap Value |
Russell 1000 Value |
Mid Cap Growth |
Wilshire Mid Growth* |
Mid Cap Value |
Wilshire Mid Value* |
Small Cap Growth |
Russell 2000 Growth |
Small Cap Value |
Russell 2000 Value |
Treasury Bills |
Treasury Bills |
|
|
Style Quadrant |
Representative Index |
Large Cap Growth |
Russell 1000 Growth |
Large Cap Value |
Russell 1000 Value |
Small Cap Growth |
Russell 2000 Growth |
Small Cap Value |
Russell 2000 Value |
|
|
US FIXED INCOME |
|
Style Category |
Representative Index |
Intermediate Bonds |
Barclays Capital Intermediate Government |
Long Term Bonds |
Barclays Capital Long Term Government |
Corporate Bonds |
Barclays Capital Credit |
Mortgage Backed |
Barclays Capital Mortgage Backed |
Treasury Bills |
Treasury Bills |
|
|
Style Quadrants |
Representative Index |
Long Credit |
Citigroup Credit 7-10 Years |
Short Credit |
Citigroup Credit 1-3 Years |
Long Treasury |
Citigroup Treasury 7-10 Years |
Short Treasury |
Citigroup Treasury 1-3 Years |
|
|
US Balance |
|
Style Category |
Representative Index |
Large Cap Growth |
Russell 1000 Growth |
Large Cap Value |
Russell 1000 Value |
Mid Cap Growth |
Wilshire Mid Growth* |
Mid Cap Value |
Wilshire Mid Value* |
Small Cap Growth |
Russell 2000 Growth |
Small Cap Value |
Russell 2000 Value |
Treasury Bills |
Treasury Bills |
Intermediate Bonds |
Barclays Capital Intermediate Government |
Long Term Bonds |
Barclays Capital Long Term Government |
Corporate Bonds |
Barclays Capital Credit |
Mortgage Backed |
Barclays Capital Mortgage Backed |
|
|
Style Quadrant |
Representative Index |
Large Cap Growth |
Russell 1000 Growth |
Large Cap Value |
Russell 1000 Value |
Small Cap Growth |
Russell 2000 Growth |
Small Cap Value |
Russell 2000 Value |
Long Credit |
Citigroup Credit 7-10 Years |
Short Credit |
Citigroup Credit 1-3 Years |
Long Treasury |
Citigroup Treasury 7-10 Years |
Short Treasury |
Citigroup Treasury 1-3 Years |
|
|
INTERNATIONAL/GLOBAL EQUITY (Regional) |
|
Style Category |
Representative Index |
Europe |
MSCI Europe |
Pacific |
MSCI Pacific |
North America |
MSCI North America |
Asia Emerging |
MSCI EMF Asia |
Europe Mid East Emerging |
MSCI EMF Europe & Mid East |
Latin America |
MSCI EMF Latin America |
Treasury Bills |
Treasury Bills |
|
|
INTERNATIONAL EQUITY (Style/Cap) |
|
Style Category |
Representative Index |
Large Cap Growth |
Citigroup PMI World X US Growth |
Large Cap Value |
Citigroup PMI World X US Value |
Small Cap Growth |
Citigroup EMI World X US Growth |
Small Cap Value |
Citigroup EMI World X US Value |
|
|
GLOBAL EQUITY (Style/Cap) |
|
Style Category |
Representative Index |
Large Cap Growth |
Citigroup PMI World Growth |
Large Cap Value |
Citigroup PMI World Value |
Small Cap Growth |
Citigroup EMI World Growth |
Small Cap Value |
Citigroup EMI World Value |
|
|
INTERNATIONAL FIXED INCOME |
|
Style Category |
Representative Index |
Global X U.S. Fixed Income |
Citigroup World Government X US |
U.S. Fixed Income |
Citigroup Broad Bond |
Treasury Bills |
Treasury Bills |
|
|
Style Quadrants |
Representative Index |
Unhedged Long Term |
Citigroup World Gov’t X US 7-10 Years |
Unhedged Short Term |
Citigroup World Gov’t X US 1-3 Years |
Hedged Long Term |
Citigroup World Gov’t X US 7-10 Years Hedged |
Hedged Short Term |
Citigroup World Gov’t X US 1-3 Years Hedged |
|
|
GLOBAL FIXED INCOME |
|
Style Category |
Representative Index |
Global X U.S. Fixed Income |
Citigroup World Government X US |
U.S. Fixed Income |
Citigroup Broad Bond |
Treasury Bills |
Treasury Bills |
|
|
Style Quadrants |
Representative Index |
Unhedged Long Term |
Citigroup World Gov’t 7-10 Years |
Unhedged Short Term |
Citigroup World Gov’t 1-3 Years |
Hedged Long Term |
Citigroup World Gov’t 7-10 Years Hedged |
Hedged Short Term |
Citigroup World Gov’t 1-3 Years Hedged |
|
|
INTERNATIONAL BALANCED |
|
Style Category |
Representative Index |
Europe |
MSCI Europe |
Pacific |
MSCI Pacific |
North America |
MSCI North America |
Asia Emerging |
MSCI EMF Asia |
Europe Mid East Emerging |
MSCI Europe & Mid East |
Latin America |
MSCI EMF Latin America |
Treasury Bills |
Treasury Bills |
Global X U.S. Fixed Income |
Citigroup World Government X US |
U.S. Fixed Income |
Citigroup Broad Bond |
|
|
Style Quadrants |
Representative Index |
Large Cap Growth |
Citigroup PMI World X US Growth |
Large Cap Value |
Citigroup PMI World X US Value |
Small Cap Growth |
Citigroup EMI World X US Growth |
Small Cap Value |
Citigroup EMI World X US Value |
Unhedged Long Term |
Citigroup World Gov’t X US 7-10 Years |
Unhedged Short Term |
Citigroup World Gov’t X US 1-3 Years |
Hedged Long Term |
Citigroup World Gov’t X US 7-10 Years Hedged |
Hedged Short Term |
Citigroup World Gov’t X US 1-3 Years Hedged |
|
|
GLOBAL BALANCED |
|
Style Category |
Representative Index |
Europe |
MSCI Europe |
Pacific |
MSCI Pacific |
North America |
MSCI North America |
Asia Emerging |
MSCI EMF Asia |
Europe Mid East Emerging |
MSCI Europe & Mid East |
Latin America |
MSCI EMF Latin America |
Treasury Bills |
Treasury Bills |
Global X U.S. Fixed Income |
Citigroup World Government X US |
U.S. Fixed Income |
Citigroup Broad Bond |
|
|
Style Quadrants |
Representative Index |
Large Cap Growth |
Citigroup PMI World Growth |
Large Cap Value |
Citigroup PMI World Value |
Small Cap Growth |
Citigroup EMI World Growth |
Small Cap Value |
Citigroup EMI World Value |
Unhedged Long Term |
Citigroup World Gov’t 7-10 Years |
Unhedged Short Term |
Citigroup World Gov’t 1-3 Years |
Hedged Long Term |
Citigroup World Gov’t 7-10 Years Hedged |
Hedged Short Term |
Citigroup World Gov’t 1-3 Years Hedged |
*Wilshire is used because the Russell Mid Cap Indices do not contain the length of history needed for complete analysis of some products.
This section contains all pre-defined universes generated by Informa Investment Solutions and available via PSN Enterprise. Based on your level of PSN Enterprise subscription, some of them may not be available to you. Please contact Informa Investment Solutions client services at clientservices@informais.com for further details.
PSN Defined Universes & Benchmarks:
PSN Defined Universe |
PSN Defined Associated Benchmark |
PSN Large Cap |
Russell 1000 |
PSN Mid Cap |
Russell Mid Cap |
PSN Small Cap |
Russell 2000 |
PSN REIT/Real Estate |
NAREIT Equity |
PSN Large Cap Growth |
Russell 1000 Growth |
PSN Large Cap Value |
Russell 1000 Value |
PSN Large Cap Core |
Standard & Poor's 500 |
PSN Mid Cap Growth |
Russell Mid Cap Growth |
PSN Mid Cap Value |
Russell Mid Cap Value |
PSN Mid Cap Core |
Standard & Poor's 400 Mid Cap |
PSN Small Cap Growth |
Russell 2000 Growth |
PSN Small Cap Value |
Russell 2000 Value |
PSN Small Cap Core |
Russell 2000 |
PSN All Cap Growth |
Russell 3000 Growth |
PSN All Cap Value |
Russell 3000 Value |
PSN All Cap Core |
Standard & Poor's 500 |
PSN Micro Cap |
Russell 2000 |
PSN All Cap |
Russell 3000 |
PSN Convertibles |
Merrill Lynch All US Convertibles |
PSN Less than 1 Year Maturity |
Merrill Lynch US Treasury Notes & Bonds 0-1 Year |
PSN Short Term Fixed Income |
Barclays Capital 1-3 Year Government Bond |
PSN Intermediate Fixed Income |
Barclays Capital Intermediate Government/Credit Bond |
PSN Long Term Fixed Income |
Barclays Capital Long Term Gov’t/Credit Bond |
PSN High Yield Fixed Income |
CSFB High Yield Index |
PSN Municipal Fixed Income |
Barclays Capital Municipal Bond |
PSN Core Fixed Income |
Barclays Capital Aggregate Bond |
PSN Core Plus Fixed Income |
Barclays Capital Aggregate Bond |
PSN Mortgage Backed |
Barclays Capital Mortgage-Backed Securities |
PSN All/Variable Maturity |
Barclays Capital Aggregate Bond |
PSN US Balanced |
60% S&P500/40% BCGC |
PSN EAFE |
MSCI EAFE Gross |
PSN Intl Emerging Markets |
MSCI Emerging Markets |
PSN International Equity |
MSCI EAFE Gross |
PSN Japanese Equity |
MSCI Japan Gross |
PSN European Equity |
MSCI Europe Gross |
PSN Global Equity |
MSCI World Gross |
PSN Global/International REIT |
MSCI World Real Estate |
PSN Global Fixed Income |
Citigroup World Government Bond |
PSN International Fixed Income |
Citigroup World Government Bond X US |
PSN Global/Intl Balanced |
60% World/40% CG World Govt |
PSN Commodities and Energy |
S&P Goldman Sachs Commodity Index |
PSN MA Core Fixed Income |
Barclays Capital Aggregate |
PSN MA Global Equity |
MSCI World Gross |
PSN MA Intermediate Fixed Income |
Barclays Capital Intermediate Govt/Credit |
PSN MA International Equity |
MSCI EAFE Gross |
PSN MA Large Cap Core |
Standard & Poor's 500 |
PSN MA Large Cap Equity |
Russell 1000 |
PSN MA Large Cap Growth |
Russell 1000 Growth |
PSN MA Large Cap Value |
Russell 1000 Value |
PSN MA Mid Cap Equity |
Russell Mid Cap |
PSN MA Mid Cap Growth |
Russell Mid Cap Growth |
PSN MA Municipal Fixed Income |
Barclays Capital Municipal |
PSN MA Global/Intl Fixed Income |
MSCI World Gross |
PSN MA Small Cap Equity |
Russell 2000 |
PSN MA Small Cap Value |
Russell 2000 Value |
PSN MA US Balanced |
60% S&P500/40% BCGC |
PSN MA US Equity |
Standard & Poor's 500 |
PSN MA US Fixed Income |
Barclays Capital Aggregate |
PSN CF Intermediate Fixed Income |
Barclays Capital Intmdt Government/Credit |
PSN CF International Equity |
MSCI EAFE Gross |
PSN CF Large Cap Core |
Standard & Poor's 500 |
PSN CF Large Cap Equity |
Russell 1000 |
PSN CF Mid Cap Equity |
Russell Mid Cap |
PSN CF Other |
MSCI World Gross |
PSN CF Small Cap Equity |
Russell 2000 |
PSN CF US Equity |
Standard & Poor's 500 |
PSN CF US Fixed Income |
Barclays Capital Aggregate |
PSN MF International Equity |
MSCI EAFE Gross |
PSN MF Other |
MSCI World Gross |
PSN MF US Balanced |
60% S&P500/40% BCGC |
PSN MF US Equity |
Standard & Poor's 500 |
PSN MF US Fixed Income |
Barclays Capital Aggregate |
Lipper Mutual Fund Data:
PSN Defined Lipper Universe |
PSN Defined Associated Benchmark |
Money Market |
Merrill Lynch 6-Month Treasury Bill |
Municipal Debt |
Barclays Capital Municipal Bond |
Telecommunication Funds |
MSCI US IMI/Telecommunications Services |
Ultra-Short Obligations Funds |
Merrill Lynch 6-Month Treasury Bill |
Emerging Markets Debt Funds |
Citigroup Global Emerging Markets Sovereign Index |
Japanese Funds |
MSCI Japan Gross |
GNMA Funds |
Barclays Capital Mortgage-Backed Securities |
Pacific Ex Japan Funds |
MSCI Pacific X Japan Gross |
Pacific Region Funds |
MSCI Pacific Gross |
Short U.S. Government Funds |
Merrill Lynch 6-Month Treasury Bill |
Specialty Diversified Equity Funds |
Standard & Poor's 500 |
Convertible Securities Funds |
Merrill Lynch US Convertible Bonds |
Short-Intermediate U.S. Government |
Barclays Capital Intermediate Government Bond |
Specialty/Miscellaneous Funds |
Standard & Poor's 500 |
Natural Resources Funds |
Standard & Poor's 500 |
U.S. Mortgage Funds |
Barclays Capital Mortgage-Backed Securities |
Utility Funds |
MSCI US IMI/Utilities |
Global Income Funds |
Citigroup World Government Bond |
Other States Intermediate Muni Debt |
Barclays Capital Municipal Bond |
Intermediate U.S. Government Funds |
Barclays Capital Intermediate Government Bond |
Financial Services Funds |
MSCI US IMI/Financials |
Multi-Sector Income Funds |
Barclays Capital Aggregate Bond |
Short Investment Grade Debt Funds |
Barclays Capital 1-3 Year Government Bond |
Short-Intermed. Invest. Grade Debt |
Barclays Capital 1-3 Year Government Bond |
Real Estate Funds |
NCREIF National Property Index |
S&P 500 Index Objective Funds |
Standard & Poor's 500 |
Corporate Debt Funds BBB-Rated |
Barclays Capital Aggregate Bond |
General U.S. Government Funds |
Barclays Capital Government Bond |
European Region Funds |
MSCI Europe Gross |
Equity Income Funds |
Standard & Poor's 500 |
Emerging Markets Funds |
MSCI Emerging Markets |
Mid-Cap Value Funds |
Russell Mid Cap Value |
Health/Biotechnology Funds |
MSCI US IMI/Health Care |
Corporate Debt Funds A Rated |
Barclays Capital Aggregate Bond |
Small-Cap Value Funds |
Russell 2000 Value |
Mid-Cap Core Funds |
Russell Mid Cap |
Flexible Portfolio Funds |
60% S&P500/40% BCGC |
Science & Technology Funds |
MSCI US IMI/Information Technology |
Large-Cap Value Funds |
Russell 1000 Value |
High Current Yield Funds |
CSFB High Yield Index |
Intermediate Investment Grade Debt |
Barclays Capital Intermediate Government Bond |
Multi-Cap Growth Funds |
Russell 3000 Growth |
Small-Cap Core Funds |
Russell 2000 |
Small-Cap Growth Funds |
Russell 2000 Growth |
Multi-Cap Value Funds |
Russell 3000 Value |
Multi-Cap Core Funds |
Russell 3000 |
Mid-Cap Growth Funds |
Russell Mid Cap Growth |
Large-Cap Growth Funds |
Russell 1000 Growth |
Large-Cap Core Funds |
Russell 1000 |
General Bond Funds |
Barclays Capital Aggregate Bond |
Global Flexible Port Funds |
60% EAFE/40% CG World GOVT |
Global Large-Cap Core |
Citigroup PMI World |
Global Large-Cap Growth |
Citigroup PMI World Growth |
Global Large-Cap Value |
Citigroup PMI World Value |
Global Multi-Cap Core |
Citigroup BMI World |
Global Multi-Cap Growth |
Citigroup BMI World Growth |
Global Multi-Cap Value |
Citigroup BMI World Value |
Gold Oriented Funds |
Standard & Poor's 500 |
International Income Funds |
MSCI World X USA Gross |
International Large-Cap Core |
Citigroup PMI World X US |
International Large-Cap Growth |
Citigroup PMI World X US Growth |
International Large-Cap Value |
Citigroup PMI World X US Value |
International Multi-Cap Core |
Citigroup BMI World X US |
International Multi-Cap Growth |
Citigroup BMI World X US Growth |
International Multi-Cap Value |
Citigroup BMI World X US Value |
International Small/Mid-Cap Core |
Citigroup EMI World X US |
International Small/Mid-Cap Growth |
Citigroup EMI World X US Growth |
Treasury Inflation Protected Securities |
Merrill Lynch US Treasuries Inflation-Linked |
China Region Funds |
MSCI Emerging Markets Asia |
Dedicated Short Bias Funds |
CSFB HEDG Dedicated Short Bias |
Loan Participation Funds |
Barclays Capital Mortgage-Backed Securities |
Mixed-Asset Target 2010 Funds |
60% S&P500/40% BCGC |
Mixed-Asset Target 2020 Funds |
60% S&P500/40% BCGC |
Mixed-Asset Target 2030 Funds |
60% S&P500/40% BCGC |
Mixed-Asset Target Alloc Consv Funds |
40% S&P500/60% BCGC |
Mixed-Asset Target Alloc Growth |
60% S&P500/40% BCGC |
Mixed-Asset Target Alloc Moderate |
50% S&P500/50% BCGC |
Long/Short Equity Funds |
Standard & Poor's 500 |
Equity Market Neutral Funds |
Standard & Poor's 500 |
Diversified Leverage Funds |
Standard & Poor's 500 |
Extended U.S. Large-Cap Core Funds |
Standard & Poor's 500 |
Global Financial Services Funds |
MSCI US IMI/Financials |
Global Health/Biotechnology Funds |
MSCI US IMI/Health Care |
Global Natural Resources Funds |
Standard & Poor's 500 |
Global Real Estate Funds |
MSCI World Real Estate |
Global Science/Technology Funds |
MSCI US IMI/Information Technology |
Global Small-/Mid-Cap Funds |
MSCI World Gross |
International Real Estate Funds |
MSCI World Real Estate |
Mixed-Asset Target 2015 Funds |
60% S&P500/40% BCGC |
Mixed-Asset Target 2025 Funds |
60% S&P500/40% BCGC |
Mixed-Asset Target 2035 Funds |
60% S&P500/40% BCGC |
Mixed-Asset Target 2040 Funds |
60% S&P500/40% BCGC |
Mixed-Asset Target 2045 Funds |
60% S&P500/40% BCGC |
Mixed-Asset Target 2050+ Funds |
60% S&P500/40% BCGC |
Commodities Funds |
S&P Goldman Sachs Commodity Index |
Other |
Standard & Poor's 500 |
Morningstar Mutual Fund Data:
PSN Defined Morningstar Mutual Fund Universe |
PSN Defined Associated Benchmark |
Bank Loan Universe |
90 Day U.S. Treasury Bill |
Bear Market Universe |
Standard & Poor's 500 |
Conservative Allocation Universe |
40% S&P500/60% BCGC |
Convertibles Universe |
Merrill Lynch All US Convertibles |
Diversified Emerging Mkts Universe |
MSCI Emerging Markets |
Diversified Pacific/Asia Universe |
MSCI Pacific Gross |
Emerging Markets Bond Universe |
Citigroup Global Emerging Markets Sovereign Index |
Europe Stock Universe |
MSCI Europe Gross |
Foreign Large Blend Universe |
MSCI AC World Index X US Free Gross |
Foreign Large Growth Universe |
MSCI AC World Index ex USA Growth |
Foreign Large Value Universe |
MSCI AC World Index ex USA Value |
Foreign Small/Mid Growth Universe |
MSCI AC World Index ex USA Growth |
Foreign Small/Mid Value Universe |
MSCI AC World Index ex USA Value |
High Yield Bond Universe |
CSFB High Yield Index |
High Yield Muni Universe |
Barclays Capital Municipal Bond |
Intermediate Government Universe |
Barclays Capital Intermediate Government Bond |
Intermediate-Term Bond Universe |
Barclays Capital Intermediate Government/Credit Bond |
Japan Stock Universe |
MSCI Japan Gross |
Large Blend Universe |
Standard & Poor's 500 |
Large Growth Universe |
Standard & Poor's 500 Growth |
Large Value Universe |
Standard & Poor's 500 Value |
Latin America Stock Universe |
MSCI Emerging Markets Free Latin America |
Long Government Universe |
Barclays Capital Long Term Government Bond |
Long-Term Bond Universe |
Barclays Capital Long Term Government/Credit Bond |
Mid-Cap Blend Universe |
Standard & Poor's 400 Mid Cap |
Mid-Cap Growth Universe |
Standard & Poor's 400 Mid Cap Growth |
Mid-Cap Value Universe |
Standard & Poor's 400 Mid Cap Value |
Moderate Allocation Universe |
40% S&P500/60% BCGC |
Multisector Bond Universe |
Barclays Capital Aggregate Bond |
Muni California Interm/Short Universe |
Barclays Capital 5 Year Municipal Bond |
Muni California Long Universe |
Barclays Capital 10 Year Municipal Bond |
Muni Massachusetts Universe |
Barclays Capital Municipal Bond |
Muni Minnesota Universe |
Barclays Capital Municipal Bond |
Muni National Interm Universe |
Barclays Capital 5 Year Municipal Bond |
Muni National Long Universe |
Barclays Capital 10 Year Municipal Bond |
Muni National Short Universe |
Barclays Capital 3 Year Municipal Bond |
Muni New Jersey Universe |
Barclays Capital Municipal Bond |
Muni New York Interm/Short Universe |
Barclays Capital 3 Year Municipal Bond |
Muni New York Long Universe |
Barclays Capital 10 Year Municipal Bond |
Muni Ohio Universe |
Barclays Capital Municipal Bond |
Muni Pennsylvania Universe |
Barclays Capital Municipal Bond |
Muni Single State Interm Universe |
Barclays Capital 5 Year Municipal Bond |
Muni Single State Long Universe |
Barclays Capital 10 Year Municipal Bond |
Muni Single State Short Universe |
Barclays Capital 3 Year Municipal Bond |
Pacific/Asia ex-Japan Stk Universe |
MSCI EAFE X Japan Gross |
Short Government Universe |
Barclays Capital 1-3 Year Government Bond |
Short-Term Bond Universe |
90 Day U.S. Treasury Bill |
Small Blend Universe |
Standard & Poor's 600 Small Cap |
Small Growth Universe |
Standard & Poor's 600 Small Cap Growth |
Small Value Universe |
Standard & Poor's 600 Small Cap Value |
Specialty-Communications Universe |
MSCI US IMI/Telecommunications Services |
Specialty-Financial Universe |
MSCI US IMI/Financials |
Specialty-Health Universe |
MSCI US IMI/Health Care |
Specialty-Natural Res Universe |
Standard & Poor's 500 |
Specialty-Precious Metals Universe |
Standard & Poor's 500 |
Specialty-Real Estate Universe |
NAREIT Equity |
Specialty-Technology Universe |
MSCI US IMI/Information Technology |
Specialty-Utilities Universe |
MSCI US IMI/Utilities |
Ultra-short Bond Universe |
90 Day U.S. Treasury Bill |
World Allocation Universe |
60% EAFE/40% CG World GOVT |
World Bond Universe |
Citigroup World Broad Investment Grade Bond |
World Stock Universe |
MSCI World Gross |
Long-Short Universe |
Standard & Poor's 500 |
Target-Date 2000-2014 Universe |
40% S&P500/60% BCGC |
Target-Date 2015-2029 Universe |
50% S&P500/50% BCGC |
Target-Date 2030+ Universe |
60% S&P500/40% BCGC |
Inflation-Protected Bond Universe |
Barclays Capital US Treasury Inflation Notes |
Money Market- Tax-Free Universe |
Merrill Lynch 6-Month Treasury Bill |
Money Market-Taxable Universe |
Merrill Lynch 6-Month Treasury Bill |
Currency Universe |
Merrill Lynch 3-Month Treasury Bill |
Global Real Estate Universe |
MSCI World Real Estate |
Barclay Hedge Fund Data:
PSN Defined Barclay Hedged Universe |
PSN Defined Associated Benchmark |
Other Equity Universe |
Standard & Poor's 500 |
Other Fixed Income Universe |
Barclays Capital Government/Credit Bond |
Sector Technology Universe |
MSCI US IMI/Information Technology |
Emerging Markets Global Universe |
MSCI Emerging Markets |
Distress Securities Universe |
Standard & Poor's 500 |
Multi Strategy Universe |
Standard & Poor's 500 |
Macro Universe |
Standard & Poor's 500 |
Event Driven Universe |
Standard & Poor's 500 |
Equity Market Neutral Universe |
90 Day U.S. Treasury Bill |
Convertible Arbitrage Universe |
Merrill Lynch All US Convertibles |
Equity Long Bias Universe |
Standard & Poor's 500 |
Equity Long Short Universe |
90 Day U.S. Treasury Bill |
Fund of Funds Universe |
Standard & Poor's 500 |
Equity Long Only Universe |
Standard & Poor's 500 |
Emerging Markets Asia Universe |
MSCI Emerging Markets Asia |
Emerging Markets Eastern Europe |
MSCI Emerging Markets Europe and Middle East |
Emerging Markets Latin America |
MSCI Emerging Markets Free Latin America |
Fixed Income Arbitrage Universe |
Barclays Capital Aggregate Bond |
Fixed Income Asset Backed Securities |
Barclays Capital Mortgage-Backed Securities |
Fixed Income Convertible Bonds |
Merrill Lynch All US Convertibles |
Fixed Income Diversified Universe |
Barclays Capital Government/Credit Bond |
Fixed Income High Yield Universe |
CSFB High Yield Index |
Fixed Income Mortgage Backed |
Barclays Capital Mortgage-Backed Securities |
Option Strategies Universe |
Standard & Poor's 500 |
Sector Energy Universe |
MSCI US IMI/Energy |
Sector Finance Universe |
MSCI US IMI/Financials |
Sector Health Care/Biotech Universe |
MSCI US IMI/Health Care |
Sector Real Estate Universe |
NAREIT Equity |
Balanced Universe |
60% S&P500/40% BCGC |
Unconstrained Investment means, not adhering to a benchmark. Rather than make investment decisions constrained by the weightings of an index, unconstrained managers often look to maximize the total return of the portfolio. Managers would be free to own LG (large growth), LV (large value), MG (mid growth), MV (mid value), SG (small growth), SV (small value), and even international equities in their pursuit of higher absolute returns. In a global context, fund managers can hold stocks of any size and within any sector, across the geographical spectrum. For Bond investing, the fund retains the characteristics of a bond fund while giving the manager flexibility to own any kind of fixed-income security that might add to returns. For balanced products, there are not restrictions among asset classes. For PSN universes, we include all vehicles in these universes. You will find SA, MA, CF, and MF.
PSN Global/Intl Balanced Unconstrained - Unconstrained Investment means, not adhering to a benchmark. Rather than make investment decisions constrained by the weightings of an index, unconstrained managers often look to maximize the total return of the portfolio. Managers would be free to own LG (large growth), LV (large value), MG (mid growth), MV (mid value), SG (small growth), SV (small value), and even international equities in their pursuit of higher absolute returns. In a global context, fund managers can hold stocks of any size and within any sector, across the geographical spectrum. For Bond investing, the fund retains the characteristics of a bond fund while giving the manager flexibility to own any kind of fixed-income security that might add to returns. There are not restrictions among asset classes. All vehicles and all Global/ International balanced products are included in these universes. Universe is available on both gross and net of fee.
PSN Global/Intl Fixed Income Unconstrained - Unconstrained Investment means, not adhering to a benchmark. Rather than make investment decisions constrained by the weightings of an index, unconstrained managers often look to maximize the total return of the portfolio. In a global context, fund managers can hold stocks of any size and within any sector, across the geographical spectrum. For Bond investing, the fund retains the characteristics of a bond fund while giving the manager flexibility to own any kind of fixed-income security that might add to returns. For balanced products, there are not restrictions among asset classes. All vehicles and all global/international fixed products are included in these universes. Universe is available on both gross and net of fee.
PSN Global Equity Unconstrained - Unconstrained Investment means, not adhering to a benchmark. Rather than make investment decisions constrained by the weightings of an index, unconstrained managers often look to maximize the total return of the portfolio. Managers would be free to own LG (large growth), LV (large value), MG (mid growth), MV (mid value), SG (small growth), SV (small value). In a global context, fund managers can hold stocks of any size and within any sector, across the geographical spectrum. All vehicles and all Global Equity products are included in these universes. Universe is available on both gross and net of fee.
PSN International Equity Unconstrained - Unconstrained Investment means, not adhering to a benchmark. Rather than make investment decisions constrained by the weightings of an index, unconstrained managers often look to maximize the total return of the portfolio. Managers would be free to own LG (large growth), LV (large value), MG (mid growth), MV (mid value), SG (small growth), SV (small value), and even international equities in their pursuit of higher absolute returns. All vehicles and all International equity products are included in these universes. Universe is available on both gross and net of fee.
PSN US Balanced Unconstrained - Unconstrained Investment means, not adhering to a benchmark. Rather than make investment decisions constrained by the weightings of an index, unconstrained managers often look to maximize the total return of the portfolio. Managers would be free to own LG (large growth), LV (large value), MG (mid growth), MV (mid value), SG (small growth), SV (small value).For Bond investing, the fund retains the characteristics of a bond fund while giving the manager flexibility to own any kind of fixed-income security that might add to returns. There are not restrictions among asset classes. All vehicles and all US balanced products are included in these universes. Universe is available on both gross and net of fee.
PSN US Equity Unconstrained - Unconstrained Investment means, not adhering to a benchmark. Rather than make investment decisions constrained by the weightings of an index, unconstrained managers often look to maximize the total return of the portfolio. Managers would be free to own LG (large growth), LV (large value), MG (mid growth), MV (mid value), SG (small growth), SV (small value), and even international equities in their pursuit of higher absolute returns. All vehicles and all US equity products are included in these universes. Universe is available on both gross and net of fee basis.
PSN US Fixed IncomeUnconstrained - Unconstrained Investment means, not adhering to a benchmark. Rather than make investment decisions constrained by the weightings of an index, unconstrained managers often look to maximize the total return of the portfolio. For Bond investing, the fund retains the characteristics of a bond fund while giving the manager flexibility to own any kind of fixed-income security that might add to returns. All vehicles and all US fixed products are included in these universes. Universe is available on both gross and net of fee basis.
Includes all SMA strategies that use options within their investment strategy. Option writing funds aim to generate a significant portion of their returns from the collection of premiums on options contracts sold. This category includes covered call strategies, put writing strategies, as well as options strategies that target returns primarily from contract premiums. Investors have a tendency to associate options with increased risk. However, when options are utilized in a "buy-write" or Covered Call strategy, they might actually reduce risk. In addition, option writing funds may seek to generate a portion of their returns, either indirectly or directly, from the volatility risk premium associated with options trading strategies. Universe is available on both gross and net of fee basis.
Global macro strategies generally focus on financial instruments that are broad in scope whose prices fluctuate based on economic, political, and capital flows around the world. Global macro strategies focus on various equity, fixed income, interest rate, currency, and stock index strategies, while using derivatives to manage risk.
NOTE: Offered under US Equity, US Fixed Income, US Balanced Global Balanced, Global Equity, Global Fixed, International Equity, International Fixed Income, International Balanced. Offered in Gross and Net of Fees.
PSN Active Extension - Includes all US, Global and International Equity products which Short High is between 1 and 90 percent and Long High is between 101 and 190 percent. Products must also rank Short Selling Style as very important. Exclude all equity products that select primary equity style Hedged, REIT or Market Neutral. Universe is available in both Gross and Net of fees.
PSN Broad Equity Aggressive- Includes all US equity products which five years Beta using the Russell 3000 index are in the top 25th percentile ranking. Universe is available on both gross and net of fee basis.
PSN Broad Equity Conservative - Includes all US equity products which five years Beta using the Russell 3000 index are in the bottom 25th percentile ranking. Universe is available on both gross and net of fee basis.
PSN Broad Equity Moderate - Includes all US equity products which five years Beta using the Russell 3000 index are between the 25th and 75th percentile ranking. Universe is available on both gross and net of fee basis.
PSN Commodities and Energy - Includes all products independently of asset class that selects Commodities/Commodities related as primary Equity or Fixed income Style. Universe is available on both gross and net of fee basis.
PSN Infrastructure - Includes all strategies that invest in infrastructure securities. It is the basic physical systems of a business or nation. The term refers to the technical structures that support a society, such as transportation, bridges, water supply, sewers, electrical grids, telecommunications, schools, power plants. It can be defined as "the physical components of interrelated systems providing commodities and services essential to enable, sustain, or enhance social living conditions. These systems tend to be high-cost investments; however, they are vital to a country's economic development and prosperity. Infrastructure projects may be funded publicly, privately or through public-private partnerships. Universe is available on both gross and net of fee basis.
PSN Master Limited Partnerships: Includes all strategies that is publicly traded on a securities exchange. It combines the tax benefits of a limited partnership with the liquidity of publicly traded securities. One of the most crucial criteria that must be met in order for a partnership to be legally classified as an MLP is that the partnership must derive most (90%) of its cash flows from real estate, natural resources and commodities. The advantage of an MLP is that it combines the tax benefits of a limited partnership (the partnership does not pay taxes from the profit - the money is only taxed when unit holders receive distributions) with the liquidity of a publicly traded company. Universe is available on both gross and net of fee basis.
PSN Micro Cap Core - same as Micro Cap Universe plus Core is chosen as primary style.
PSN Micro Cap Growth - same as Micro Cap Universe plus Growth is chosen as primary style.
PSN Micro Cap Value - same as Micro Cap Universe plus Value is chosen as primary style.
PSN Mega Cap – Includes US equity products that select Mega Cap (> 50 billion) as their primary market capitalization range. REIT and convertible products are excluded. Universe is available on both gross and net of fee basis.
PSN Mega Cap Core- same as Mega Cap Universe plus Core is chosen as primary style.
PSN Mega Cap Growth - same as Mega Cap Universe plus Growth is chosen as primary style.
PSN Mega Cap Value - same as Mega Cap Universe plus Value is chosen as primary style.
PSN US All Cap Core - same as All Cap Universe plus Core is chosen as primary style.
PSN US All Cap Growth - same as All Cap Universe plus Growth is chosen as primary style.
PSN US All Cap - Includes US equity products that select All Cap or no primary market capitalization as their primary market capitalization range. REIT and convertible products are excluded. Universe is available on both gross and net of fee basis.
PSN US All Cap Value - same as All Cap Universe plus Value is chosen as primary style.
PSN US Core - Includes all US equity products that choose Core as their primary style objective. Universe is available on both gross and net of fee basis.
PSN US Equity Index Enhanced - Includes all US Equity products which select “Equity Approach” as “Index Enhanced”. Universe is available on both gross and net of fee basis.
PSN US Equity Index Passive - Includes all US Equity products which select “Equity Approach” as “Index Passive”. Universe is available on both gross and net of fee basis.
PSN US Equity Socially Responsible -Includes all Equity Products which select “ETI/Socially Responsible” as Very Important. Universe is available on both gross and net of fee basis.
PSN US Equity - Includes all products that invest in any US equity style. Universe is available on both gross and net of fee basis.
PSN US GARP - Includes all US equity products that choose GARP (Growth At a Reasonable Price) as their primary style. Universe is available on both gross and net of fee basis.
PSN US Growth - Includes all US equity products that choose Growth as their primary style objective. Universe is available on both gross and net of fee basis.
PSN US High Income - Includes all US equity products which select “High Income” under primary equity style as very important. Universe is available on both gross and net of fee basis.
PSN US Large Cap Core - same as Large Cap Universe plus Core is chosen as primary style.
PSN US Large Cap Enhanced S&P 500– Includes all US equity products that select Large Capitalization (10-50 billion) or Mega Capitalization (> 50 billion) as their primary market capitalization range and their investment approach is index enhanced. The manager-designated benchmark for these products is S&P 500 or S&P 500 with income. Universe is available on both gross and net of fee basis.
PSN US Large Cap Growth - same as Large Cap Universe plus Growth is chosen as primary style.
PSN US Large Cap - Includes US equity products that select Large Cap (10-50 billion) as their primary market capitalization range. REIT and convertible products are excluded. Universe is available on both gross and net of fee basis.
PSN US Large Cap Value - same as Large Cap Universe plus Value is chosen as primary style.
PSN US Market Neutral– Includes all US equity products whose primary equity style is market neutral. Universe is available on both gross and net of fee basis.
PSN US Micro Cap - Includes US equity products that select Micro Cap (Less than 500 million) as their primary capitalization range. REIT and convertible products are excluded. Universe is available on both gross and net of fee basis.
PSN US Mid Cap Core - same as Mid Cap Universe plus Core is chosen as primary style.
PSN US Mid Cap Growth - same as Mid Cap Universe plus Growth is chosen as primary style.
PSN US Mid Cap - Includes US equity products that select Mid Cap (2 – 10 billion) as their primary market capitalization range. REIT and convertible products are excluded. Universe is available on both gross and net of fee basis.
PSN US Mid Cap Value - same as Mid Cap Universe plus Value is chosen as primary style.
PSN US REIT/Real Estate - Includes all US equity products that select REIT as their primary style. Universe is available on both gross and net of fee basis.
PSN US Small Cap Core - same as Small Cap Universe plus Core is chosen as the primary style.
PSN US Small Cap Growth Universe- same as Small Cap Universe plus Growth is chosen as the primary style.
PSN US Small Cap - Includes US equity products that select Small Cap (500 million – 2 billion) as their primary market capitalization range. REIT and convertible products are excluded. Universe is available on both gross and net of fee basis.
PSN US Small Cap Value - same as Small Cap Universe plus Value is chosen as the primary style.
PSN US Small-Mid Cap - Includes all US equity products excluding all REIT/Real Estate products. These products select Small Cap (500 million – 2 billion) or Mid Cap (2 – 10 billion) as their primary market capitalization. These products must also have the Small Cap and Mid Cap as either important or very important in their style ranking, and their weighted average market cap must be between 1500 and 5500 where the smallest market cap is from 0 to 2000 and the largest market cap is from 2000 to 25000. Products that select Large Cap (10-50 billion) or Mega Cap (> 50 Billion) or Micro Cap (Less than 500 million) or All Cap as primary market capitalization are not included. This Universe is available on both gross and net of fee basis.
PSN US Small-Mid Core - Same as Small Mid Cap Universe plus Core is chosen as the primary style.
PSN US Small-Mid Growth - Same as Small Mid Cap Universe plus Growth is chosen as the primary style.
PSN US Small-Mid Value - Same as Small Mid Cap Universe plus Value is chosen as the primary style.
PSN US Value - Includes all US equity products that choose Value as their primary style objective. Universe is available on both gross and net of fee basis.
PSN All/Variable Maturity - Includes products that invest in any US fixed income style and choose all, variable or no particular maturity as their primary maturity. Convertible and high yield products are excluded. Universe is available on both gross and net of fee basis.
PSN Core Fixed Income - Includes US fixed income products that choose core as their primary style objective. Universe is available on both gross and net of fee basis.
PSN Core Plus Fixed Income - Includes US fixed income products that choose core plus as their primary style objective. Universe is available on both gross and net of fee basis.
PSN Corporate Bond Managers - Includes US fixed income products that choose corporate as their primary style objective. Universe is available on both gross and net of fee basis.
PSN Fixed Income excluding High Yield, Convertible and Cash - Includes all products that invest in any US fixed income style excluding the High Yield, Convertible and Less than 1 Yr Maturity universes. Universe is available on both gross and net of fee basis.
PSN Fixed Income Socially Responsible - Includes all US, Global and International Fixed income products which select “ETI/Socially Responsible” under Primary Fixed Income Style as Very important. Universe is available on both gross and net of fee basis.
PSN Government Bond Managers - Includes US fixed income products that choose governments as their primary style objective. Universe is available on both gross and net of fee basis.
PSN Government Short Term Fixed- Includes all US fixed income products which primary style is government and primary maturity is less than one year or short maturity. Universe is available on both gross and net of fee basis.
PSN High Yield Fixed Income - Includes US fixed income products that choose lower quality/high yield as their primary style objective. Universe is available on both gross and net of fee basis.
PSN High Yield Intermediate- Includes all US fixed income products which primary style is high yield and primary maturity is intermediate maturity. Universe is available on both gross and net of fee basis.
PSN Infrastructure - Includes all strategies that invest in infrastructure securities. It is the basic physical systems of a business or nation. The term refers to the technical structures that support a society, such as transportation, bridges, water supply, sewers, electrical grids, telecommunications, schools, power plants. It can be defined as "the physical components of interrelated systems providing commodities and services essential to enable, sustain, or enhance social living conditions. These systems tend to be high-cost investments; however, they are vital to a country's economic development and prosperity. Infrastructure projects may be funded publicly, privately or through public-private partnerships. Universe is available on both gross and net of fee basis.
PSN Intermediate Municipal Fixed Income– Includes all US fixed income products that choose municipals as their primary style objective and their primary maturity is intermediate (3-7 years) maturity. Universe is available on both gross and net of fee basis.
PSN Investment Grade Fixed Income- Includes all US fixed income products which quality ratings for AAA+, AA+, A+ BBB is equal or more than 75% for the most current calendar year. Universe is available on both gross and net of fee basis.
PSN Investment Grade Fixed Income Intermediate - Includes all US fixed income products which primary maturity is intermediate maturity. The products also must have quality ratings for AAA+, AA+, A+, BBB equal or more than 75% for the most current calendar year. Universe is available on both gross and net of fee basis.
PSN Investment Grade Fixed Income Long Term - Includes all US fixed income products which primary maturity is long maturity. The products also must have quality ratings for AAA+, AA+, A+, BBB equal or more than 75% for the most current calendar year. Universe is available on both gross and net of fee basis.
PSN Investment Grade Fixed Income Short Term - Includes all US fixed income products which primary maturity is less than one year or short maturity. The products also must have quality ratings for AAA+, AA+, A+, BBB is equal or more than 75% for the most current calendar year. Universe is available on both gross and net of fee basis.
PSN Long Municipal Fixed Income– Includes all US fixed income products that choose municipals as their primary style objective and their primary maturity is long (over 7 years) maturity. Universe is available on both gross and net of fee basis.
PSN Mortgage Backed - Includes US fixed income products that choose mortgage backed, adjustable rate mortgage pools or CMO’s as their primary style objective. Universe is available on both gross and net of fee basis.
PSN Municipal Fixed Income - Includes US fixed income products that choose municipals as their primary style objective. Universe is available on both gross and net of fee basis.
PSN Short Municipal Fixed Income– Includes all US fixed income products that choose municipals as their primary style objective and their primary maturity is short (1-3 years) maturity. Universe is available on both gross and net of fee basis.
PSN US Bank Loans - Includes all US fixed Income products which select “Bank Loans” under fixed income style as very important. Universe is available on both gross and net of fee basis.
PSN US Fixed Income - Includes all products that invest in any US fixed income style. Universe is available on both gross and net of fee basis.
PSN US Intermediate Fixed Income - Includes products that invest in any US fixed income style and choose intermediate (3-7 years) as their primary maturity. Convertible and high yield products are excluded. Universe is available on both gross and net of fee basis.
PSN US Less than 1 Year Maturity - Includes products that invest in any US fixed income style and choose less than 1 year as their primary maturity. Convertible and high yield products are excluded. Universe is available on both gross and net of fee basis.
PSN US Long Term Fixed Income - Includes products that invest in any US fixed income style and choose long (over 7 years) as their primary maturity. Convertible and high yield products are excluded. Universe is available on both gross and net of fee basis.
PSN US Short Term Fixed Income - Includes products that invest in any US fixed income style and choose short (1-3 years) as their primary maturity. Convertible and high yield products are excluded. Universe is available on both gross and net of fee basis.
PSN US Stable Value Fixed - Includes all US Fixed Income Products which select “Stable Value/GICS” under fixed income style as “Very important”. Universe is available on both gross and net of fee basis.
PSN US TIPS - Includes all US Fixed income products which select “TIPS” under Fixed Income Style as “Very Important”. Universe is available on both gross and net of fee basis.
PSN Balanced Aggressive - Includes all US balanced products whose equity allocation objective is greater than or equal to 65%. Universe is available on both gross and net of fee basis.
PSN Balanced Conservative- Includes all US balanced products whose equity allocation objective is equal or less than 54%. Universe is available on both gross and net of fee basis.
PSN Balanced Moderate - Includes all US balanced products whose equity allocation objective is between 55% and 64%. Universe is available on both gross and net of fee basis.
PSN Infrastructure - Includes all strategies that invest in infrastructure securities. It is the basic physical systems of a business or nation. The term refers to the technical structures that support a society, such as transportation, bridges, water supply, sewers, electrical grids, telecommunications, schools, power plants. It can be defined as "the physical components of interrelated systems providing commodities and services essential to enable, sustain, or enhance social living conditions. These systems tend to be high-cost investments; however, they are vital to a country's economic development and prosperity. Infrastructure projects may be funded publicly, privately or through public-private partnerships. Universe is available on both gross and net of fee basis.
PSN Target Date - Includes all US, Global and International Balanced products which select Target Date under Balanced Decision Making as very important. Universe is available on both gross and net of fee basis.
PSN US Balanced - Includes products that invest, in some portion, U.S. equities, fixed income and cash equivalents. The product should be run as a whole and not a combination of existing equity and fixed income products. Average asset allocation is generally 60% equity and 40% fixed income. Universe is available on both gross and net of fee basis.
PSN US Convertible - Includes all equity, fixed income and balanced products that choose convertibles as their primary style. Universe is available on both gross and net of fee basis.
PSN US TAA - Includes all US Balanced products which select “Tactical Asset Allocation” under Balanced Decision Making as “very important”. Universe is available on both gross and net of fee basis.
PSN Canadian Equity - Includes all International equity products that choose “Canada” under the “Country” Specific in Regions section. Universe is available on both gross and net of fee basis.
PSN Country Specific - Includes all International Equity products that choose “Country Specific” as “Yes”. Universe is available on both gross and net of fee basis.
PSN EAFE - Includes all equity products which, as policy, do not invest in U.S. equities. Products must choose EAFE as their geographic concentration or international equity as a geographic concentration while choosing MSCI EAFE as their benchmark. This excludes all products which choose REIT or Commodities as their primary investment style. Universe is available on both gross and net of fee basis.
PSN EAFE All Cap - Includes all equity products which, as policy, do not invest in U.S. equities. Products must choose EAFE or international equity as their geographic concentration while choosing MSCI EAFE as their benchmark. Products must choose “All Capitalization” as their primary market capitalization. Universe is available on both gross and net of fee basis.
PSN EAFE Large Cap - Includes all equity products which, as policy, do not invest in U.S. equities. Products must choose EAFE or international equity as their geographic concentration while choosing MSCI EAFE as their benchmark. Products must choose Large Capitalization (10-50 billion) or Mega Capitalization (> 50 billion) as their primary market capitalization range. Universe is available on both gross and net of fee basis.
PSN EAFE Small Cap - Includes all equity products which, as policy, do not invest in U.S. equities. Products must choose EAFE or international equity as their geographic concentration while choosing MSCI EAFE as their benchmark. Products must choose “Small Capitalization (500 $Million - 2 $Billion)” as their primary market capitalization range. Universe is available on both gross and net of fee basis.
PSN European Equity - Includes all equity products which, as policy, do not invest in U.S. equities. Products must choose Europe, Europe EX U.K.as their geographic concentration. This excludes all products which choose REIT or Commodities as their primary investment style. Universe is available on both gross and net of fee basis.
PSN Global / International REIT Universe - Includes all global equity or international equity products that choose REIT as their primary equity style. This universe is also included in the Global or International equity universes. Universe is available on both gross and net of fee basis.
PSN Global Equity Universe- Includes all equity products that are not constrained by any geographic regions. This excludes all products which choose REIT or Commodities as their primary investment style. Universe is available on both gross and net of fee basis.
PSN Global Growth Universe – Includes all global equity products which primary equity style is growth. Universe is available on both gross and net of fee basis.
PSN Global High Income - Includes all global equity products which select “High Income” under primary equity style as very important. Universe is available on both gross and net of fee basis.
PSN Global Large Cap - Includes all global equity products, the products must choose “Large Capitalization (10-50 billion) or Mega Capitalization (> 50 billion) as their primary market capitalization range. Universe is available on both gross and net of fee basis.
PSN Global Small Cap - Includes all global equity products, the products must choose “Small Capitalization (500 $Million - 2 $Billion)” as their primary market capitalization range. Universe is available on both gross and net of fee basis.
PSN Global Value Universe – Includes all global equity products which primary equity style is value. Universe is available on both gross and net of fee basis.
PSN Global/Intl ADR - Includes all global or international equity products that select “American Depositary Receipts” under primary equity style as very important. Universe is available on both gross and net of fee basis.
PSN Global/Intl Equity Socially Responsible - Includes all Global and International Equity Products which select “ETI/Socially Responsible” under Primary Equity style as Very important. Universe is available on both gross and net of fee basis.
PSN Infrastructure - Includes all strategies that invest in infrastructure securities. It is the basic physical systems of a business or nation. The term refers to the technical structures that support a society, such as transportation, bridges, water supply, sewers, electrical grids, telecommunications, schools, power plants. It can be defined as "the physical components of interrelated systems providing commodities and services essential to enable, sustain, or enhance social living conditions. These systems tend to be high-cost investments; however, they are vital to a country's economic development and prosperity. Infrastructure projects may be funded publicly, privately or through public-private partnerships. Universe is available on both gross and net of fee basis.
PSN International Equity Emerging Markets Universe - Includes all equity products which, as policy, do not invest in U.S. equities and choose Emerging Markets, ‘Brazil, Russia, India and China’(BRIC), Emerging Markets Latin America, Emerging Markets Far East, Emerging Markets Asia, and Emerging Markets Eastern Europe as their geographic concentration. Universe is available on both gross and net of fee basis.
PSN International Equity Excluding Emerging Markets Universe - Includes all equity products which, as policy, do not invest in U.S. equities and do not choose Emerging Markets, Emerging Markets Latin America, Emerging Markets Far East, Emerging Markets Asia, ‘Brazil, Russia, India China’(BRIC) and Emerging Markets Eastern Europe as their geographic concentration. Universe is available on both gross and net of fee basis.
PSN International Equity Universe- Includes all equity products which, as policy, do not invest in U.S. equities. This excludes all products which choose REIT or Commodities as their primary investment style. The products which choose Emerging, EAFE and European are excluded from this universe. Universe is available on both gross and net of fee basis.
PSN International Growth Universe- Includes all equity products which, as policy, do not invest in U.S. equities and choose Growth as their primary style objective. Universe is available on both gross and net of fee basis.
PSN International Large Cap Equity Universe - Includes all equity products which, as policy, do not invest in U.S. equities. Products must choose large cap (10-50 billion) or Mega Capitalization (> 50 billion) as their primary market capitalization range. Universe is available on both gross and net of fee basis.
PSN International Small Cap Equity Universe - Includes all equity products which, as policy, do not invest in U.S. equities. Products must choose small cap (500 million – 2 billion) as their primary market capitalization range. Universe is available on both gross and net of fee basis.
PSN International Value Universe- Includes all equity products which, as policy, do not invest in U.S. equities and choose Value as their primary style objective. Universe is available on both gross and net of fee basis.
PSN Intl & Global Equity ex Emerging Markets Universe – All international and global equity products excluding those whose product specification based on geographic region is Emerging Markets, Emerging Markets Latin America, Emerging Markets Far East, Emerging Markets Asia, ‘Brazil, Russia, India and China’(BRIC) and Emerging Markets Eastern Europe. Universe is available on both gross and net of fee basis.
PSN Japanese Equity Universe- Includes all equity products which, as policy, do not invest in U.S. equities and choose Japan as their Country Specific. Universe is available on both gross and net of fee basis.
PSN Pure International Equity Universe – Includes all international equity products, where the geographic concentration is EAFE or World Ex-US. This excludes all REIT or Real Estate products. Universe is available on both gross and net of fee basis.
PSN Fixed Income Socially Responsible - Includes all US, Global and International Fixed income products which select “ETI/Socially Responsible” under Primary Fixed Income Style as Very important. Universe is available on both gross and net of fee basis.
PSN Global Fixed Income Universe- Includes all fixed income products that are not constrained by any geographic regions. Universe is available on both gross and net of fee basis.
PSN Global TIPS - Includes all global fixed Income products which select “TIPS” under primary fixed income style as very important. Universe is available on both gross and net of fee basis.
PSN Infrastructure - Includes all strategies that invest in infrastructure securities. It is the basic physical systems of a business or nation. The term refers to the technical structures that support a society, such as transportation, bridges, water supply, sewers, electrical grids, telecommunications, schools, power plants. It can be defined as "the physical components of interrelated systems providing commodities and services essential to enable, sustain, or enhance social living conditions. These systems tend to be high-cost investments; however, they are vital to a country's economic development and prosperity. Infrastructure projects may be funded publicly, privately or through public-private partnerships. Universe is available on both gross and net of fee basis.
PSN International Emerging Markets Debt Universe – Includes all international fixed income products that choose Emerging Markets Debt as their primary fixed income style. Universe is available on both gross and net of fee basis.
PSN International Fixed Income Universe- Includes all fixed income products which, as policy, do not invest in U.S. fixed income products (excluding cash equivalents). Universe is available on both gross and net of fee basis.
PSN Global / International Balanced -Includes products that invest, in some portion, equities, and fixed income and cash equivalents and are not constrained by any geographic regions. The product should be run as a whole and not a combination of existing equity and fixed income products. Universe is available on both gross and net of fee basis.
PSN Global/Intl TAA - Includes all Global and International Balanced products which select “Tactical Asset Allocation” under Balanced Decision Making as very important. Universe is available on both gross and net of fee basis.
PSN Infrastructure - Includes all strategies that invest in infrastructure securities. It is the basic physical systems of a business or nation. The term refers to the technical structures that support a society, such as transportation, bridges, water supply, sewers, electrical grids, telecommunications, schools, power plants. It can be defined as "the physical components of interrelated systems providing commodities and services essential to enable, sustain, or enhance social living conditions. These systems tend to be high-cost investments; however, they are vital to a country's economic development and prosperity. Infrastructure projects may be funded publicly, privately or through public-private partnerships. Universe is available on both gross and net of fee basis.
PSN RBSA Broad Growth - Includes all US equity products which Large Cap Growth + Mid Cap Growth + Small Cap Growth style allocation is greater than or equal to 50%. Universe is available on both gross and net of fee basis.
PSN RBSA Broad Growth Aggressive - Includes all US equity products which Large Cap Growth + Mid Cap Growth + Small Cap Growth style allocation is greater than or equal to 50%. Moreover, products that pass the criteria will have to be in the top 25th percentile ranking for their five year Beta using Russell 3000 Growth. Universe is available on both gross and net of fee basis.
PSN RBSA Broad Growth Conservative - Includes all US equity products which Large Cap Growth + Mid Cap Growth + Small Cap Growth style allocation is greater than or equal to 50%. Moreover, products that pass the criteria will have to be in the bottom 25th percentile ranking for their five year Beta using Russell 3000 Growth. Universe is available on both gross and net of fee basis.
PSN RBSA Broad Growth Moderate - Includes all US equity products which Large Cap Growth + Mid Cap Growth + Small Cap Growth style allocation is greater than or equal to 50%. Moreover, products that pass the criteria will have to be between the 25th and 75th percentile ranking for their five year Beta using Russell 3000 Growth. Universe is available on both gross and net of fee basis.
PSN RBSA Broad Large Cap - Includes all US equity products which Large Cap Growth + Large Cap Value style allocation is greater than or equal to 50%. Moreover, products that pass the criteria will have also a five year Tracking Error (sample) calculated using Russell 1000 less than or equal to the median of the Domestic Equity Universe. Universe is available on both gross and net of fee basis.
PSN RBSA Broad Large Cap Aggressive - Includes all US equity products which Large Cap Growth + Large Cap Value style allocation is greater than or equal to 50%. Moreover, products that pass the criteria will have also a five year Tracking Error (sample) calculated using Russell 1000 less than or equal to the median of the US Equity Universe. Products will also have to be in the top 25th percentile ranking for their five year Beta using Russell 1000. Universe is available on both gross and net of fee basis.
PSN RBSA Broad Large Cap Conservative - Includes all US equity products which Large Cap Growth + Large Cap Value style allocation is greater than or equal to 50%. Moreover, products that pass the criteria will have also a five year Tracking Error (sample) calculated using Russell 1000 less than or equal to the median of the US Equity Universe. Products will have to be in the bottom 25th percentile ranking for their five year Beta using Russell 1000. Universe is available on both gross and net of fee basis.
PSN RBSA Broad Large Cap Moderate - Includes all US equity products which Large Cap Growth + Large Cap Value style allocation is greater than or equal to 50%. Moreover, products that pass the criteria will have also a five year Tracking Error (sample) calculated using Russell 1000 less than or equal to the median of the US Equity Universe. Products will also have to be between the 25th and 75th percentile ranking for their five year Beta using Russell 1000. Universe is available on both gross and net of fee basis.
PSN RBSA Broad Large Cap Growth - Includes all US equity products which Large Cap Growth style allocation is greater than or equal to 50%. Moreover, products that pass the criteria will have also a five year Tracking Error (sample) calculated using Russell 1000 Growth less than or equal to the median of the US Equity Universe. Universe is available on both gross and net of fee basis.
PSN RBSA Broad Large Cap Growth Aggressive - Includes all US equity products which Large Cap Growth style allocation is greater than or equal to 50%. Moreover, products that pass the criteria will have also a five year Tracking Error (sample) calculated using Russell 1000 Growth less than or equal to the median of the US Equity Universe. Products will also have to be in the top 25th percentile ranking for their five year Beta using Russell 1000 Growth. Universe is available on both gross and net of fee basis.
PSN RBSA Broad Large Cap Growth Conservative - Includes all US equity products which Large Cap Growth style allocation is greater than or equal to 50%. Moreover, products that pass the criteria will have also a five year Tracking Error (sample) calculated using Russell 1000 Growth less than or equal to the median of the US Equity Universe. Products will also have to be in the bottom 25th percentile ranking for their five year Beta using Russell 1000 Growth. Universe is available on both gross and net of fee basis.
PSN RBSA Broad Large Cap Growth Moderate - Includes all US equity products which Large Cap Growth style allocation is greater than or equal to 50%. Moreover, products that pass the criteria will have also a five year Tracking Error (sample) calculated using Russell 1000 Growth less than or equal to the median of the US Equity Universe. Products will also have to be between the 25th and 75th percentile ranking for their five year Beta using Russell 1000 Growth. Universe is available on both gross and net of fee basis.
PSN RBSA Broad Large Cap Value - Includes all US equity products which Large Cap Value style allocation is greater than or equal to 50%. Moreover, products that pass the criteria will have also a five year Tracking Error (sample) calculated using Russell 1000 Value less than or equal to the median of the US Equity Universe. Universe is available on both gross and net of fee basis.
PSN RBSA Broad Large Cap Value Aggressive - Includes all US equity products which Large Cap Value style allocation is greater than or equal to 50%. Moreover, products that pass the criteria will have also a five year Tracking Error (sample) calculated using Russell 1000 Value less than or equal to the median of the US Equity Universe. Products will also have to be in the top 25th percentile ranking for their five year Beta using Russell 1000 Value. Universe is available on both gross and net of fee basis.
PSN RBSA Broad Large Cap Value Conservative - Includes all US equity products which Large Cap Value style allocation is greater than or equal to 50%. Moreover, products that pass the criteria will have also a five year Tracking Error (sample) calculated using Russell 1000 Value less than or equal to the median of the US Equity Universe. Products will also have to be in the bottom 25th percentile ranking for their five year Beta using Russell 1000 Value. Universe is available on both gross and net of fee basis.
PSN RBSA Broad Large Cap Value Moderate - Includes all US equity products which Large Cap Value style allocation is greater than or equal to 50%. Moreover, products that pass the criteria will have also a five year Tracking Error (sample) calculated using Russell 1000 Value less than or equal to the median of the US Equity Universe. Products will also have to be between the 25th and 75th percentile ranking for their five year Beta using Russell 1000 Value. Universe is available on both gross and net of fee basis.
PSN RBSA Broad Small Cap - Includes all US equity products which Small Cap Value + Small Cap Growth style allocations is greater than or equal to 50%. Moreover, products that pass the criteria will have also a five year Tracking Error (sample) calculated using Russell 2000 less than or equal to the median of the US Equity Universe. Universe is available on both gross and net of fee basis.
PSN RBSA Broad Small Cap Aggressive - Includes all US equity products which Small Cap Value + Small Cap Growth style allocation is greater than or equal to 50%. Moreover, products that pass the criteria will have also a five year Tracking Error (sample) calculated using Russell 2000 less than or equal to the median of the US Equity Universe. Products will also have to be in the top 25th percentile ranking for their five year Beta using Russell 2000. Universe is available on both gross and net of fee basis.
PSN RBSA Broad Small Cap Conservative - Includes all US equity products which Small Cap Value + Small Cap Growth style allocation is greater than or equal to 50%. Moreover, products that pass the criteria will have also a five year Tracking Error (sample) calculated using Russell 2000 less than or equal to the median of the US Equity Universe. Products will also have to be in the bottom 25th percentile ranking for their five year Beta using Russell 2000. Universe is available on both gross and net of fee basis.
PSN RBSA Broad Small Cap Moderate - Includes all US equity products which Small Cap Value + Small Cap Growth style allocation is greater than or equal to 50%. Moreover, products that pass the criteria will have also a five year Tracking Error (sample) calculated using Russell 2000 less than or equal to the median of the US Equity Universe. Products will also have to be in between the 25th and 75th percentile ranking for their five year Beta using Russell 2000. Universe is available on both gross and net of fee basis.
PSN RBSA Broad Small Cap Growth - Includes all US equity products which Small Cap Growth style allocation is greater than or equal to 50%. Moreover, products that pass the criteria will also have a five year Tracking Error (sample) calculated using Russell 2000 Growth less than or equal to the median of the US Equity Universe. Universe is available on both gross and net of fee basis.
PSN RBSA Broad Small Cap Growth Aggressive - Includes all US equity products which Small Cap Growth style allocation is greater than or equal to 50%. Moreover, products that pass the criteria will also have a five year Tracking Error (sample) calculated using Russell 2000 Growth less than or equal to the median of the US Equity Universe. Products will also have to be in the top 25th percentile ranking for their five year Beta using Russell 2000 Growth. Universe is available on both gross and net of fee basis.
PSN RBSA Broad Small Cap Growth Conservative - Includes all US equity products which Small Cap Growth style allocation is greater than or equal to 50%. Moreover, products that pass the criteria will also have a five year Tracking Error (sample) calculated using Russell 2000 Growth less than or equal to the median of the US Equity Universe. Products will also have to be in the bottom 25th percentile ranking for their five year Beta using Russell 2000 Growth. Universe is available on both gross and net of fee basis.
PSN RBSA Broad Small Cap Growth Moderate - Includes all US equity products which Small Cap Growth style allocation is greater than or equal to 50%. Moreover, products that pass the criteria will also have a five year Tracking Error (sample) calculated using Russell 2000 Growth less than or equal to the median of the US Equity Universe. Products will also have to be in between the 25th and 75th percentile ranking for their five year Beta using Russell 2000 Growth. Universe is available on both gross and net of fee basis.
PSN RBSA Broad Small Cap Value- Includes all US equity products which Small Cap Value style allocation is greater than or equal to 50%. Moreover, products that pass the criteria will also have a five year Tracking Error (sample) calculated using Russell 2000 Value less than or equal to the median of the US Equity Universe. Universe is available on both gross and net of fee basis.
PSN RBSA Broad Small Cap Value Aggressive - Includes all US equity products which Small Cap Value style allocation is greater than or equal to 50%. Moreover, products that pass the criteria will also have a five year Tracking Error (sample) calculated using Russell 2000 Value less than or equal to the median of the US Equity Universe. Products will also have to be in the top 25th percentile ranking for their five year Beta using Russell 2000 Value. Universe is available on both gross and net of fee basis.
PSN RBSA Broad Small Cap Value Conservative - Includes all US equity products which Small Cap Value style allocation is greater than or equal to 50%. Moreover, products that pass the criteria will also have a five year Tracking Error (sample) calculated using Russell 2000 Value less than or equal to the median of the US Equity Universe. Products will also have to be in the bottom 25th percentile ranking for their five year Beta using Russell 2000 Value. Universe is available on both gross and net of fee basis.
PSN RBSA Broad Small Cap Value Moderate- Includes all US equity products which Small Cap Value style allocation is greater than or equal to 50%. Moreover, products that pass the criteria will also have a five year Tracking Error (sample) calculated using Russell 2000 Value less than or equal to the median of the US Equity Universe. Products will also have to be in between the 25th and 75th percentile ranking for their five year Beta using Russell 2000 Value. Universe is available on both gross and net of fee basis.
PSN RBSA Broad Value - Includes all US equity products which Large Cap Value + Mid Cap Value + Small Cap Value style allocation is greater than or equal to 50%. Universe is available on both gross and net of fee basis.
PSN RBSA Broad Value Aggressive- Includes all US equity products which Large Cap Value + Mid Cap Value + Small Cap Value style allocation is greater than or equal to 50%. Moreover, products that pass the criteria will have to be in the top 25th percentile ranking for their five year Beta using Russell 3000 Value. Universe is available on both gross and net of fee basis.
PSN RBSA Broad Value Conservative- Includes all US equity products which Large Cap Value + Mid Cap Value + Small Cap Value style allocation is greater than or equal to 50%. Moreover, products that pass the criteria will have to be in the bottom 25th percentile ranking for their five year Beta using Russell 3000 Value. Universe is available on both gross and net of fee basis.
PSN RBSA Broad Value Moderate- Includes all US equity products which Large Cap Value + Mid Cap Value + Small Cap Value style allocation is greater than or equal to 50%. Moreover, products that pass the criteria will have to be in between the 25th and 75th percentile ranking for their five year Beta using Russell 3000 Value. Universe is available on both gross and net of fee basis.
PSN RBSA Mid Cap - Includes all US equity products which Mid Cap Growth plus Mid Cap Value style allocation is greater than or equal to 45 %. Moreover, products that pass the criteria will have also a five year Tracking Error (sample) calculated using Russell Mid Cap less than or equal to the median of the US Equity Universe. Universe is available on both gross and net of fee basis.
PSN RBSA Mid Cap Growth - Includes all US equity products which Mid Cap Growth style allocation is greater than or equal to 45%. Moreover, products that pass the criteria will have also a five year Tracking Error (sample) calculated using Russell Mid Cap Growth less than or equal to the median of the US Equity Universe. Universe is available on both gross and net of fee basis.
PSN RBSA Mid Cap Value - Includes all US equity products which Mid Cap Value style allocation is greater than or equal to 45%. Moreover, products that pass the criteria will have also a five year Tracking Error (sample) calculated using Russell Mid Cap Value less than or equal to the median of the US Equity Universe. Universe is available on both gross and net of fee basis.
PSN RBSA Pure Growth - Includes all US equity products which Large Cap Growth + Mid Cap Growth + Small Cap Growth style allocation is greater than or equal to 75%. Russell Universe is available on both gross and net of fee basis.
PSN RBSA Pure Growth Aggressive- Includes all US equity products which Large Cap Growth + Mid Cap Growth + Small Cap Growth style allocation is greater than or equal to 75%. Moreover, products that pass the criteria will have to be in the top 25th percentile ranking for their five year Beta using Russell 3000 Growth. Universe is available on both gross and net of fee basis.
PSN RBSA Pure Growth Conservative- Includes all US equity products which Large Cap Growth + Mid Cap Growth + Small Cap Growth style allocation is greater than or equal to 75%. More over products that pass the criteria will have to be in the bottom 25th percentile ranking for their five year Beta using Russell 3000 Growth. Universe is available on both gross and net of fee basis.
PSN RBSA Pure Growth Moderate- Includes all US equity products which Large Cap Growth + Mid Cap Growth + Small Cap Growth style allocation is greater than or equal to 75%. Moreover, products that pass the criteria will have to be between the 25th and 75th percentile ranking for their five year Beta using Russell 3000 Growth. Universe is available on both gross and net of fee basis.
PSN RBSA Pure Large Cap - Includes all US equity products which Large Cap Growth + Large Cap Value style allocation is greater than or equal to 75%. Moreover, products that pass the criteria will also have a five year Tracking Error (sample) calculated using Russell 1000 less than or equal to the median of the US Equity Universe. Universe is available on both gross and net of fee basis.
PSN RBSA Pure Large Cap Aggressive - Includes all US equity products which Large Cap Growth + Large Cap Value style allocation is greater than or equal to 75%. Moreover, products that pass the criteria will also have a five year Tracking Error (sample) calculated using Russell 1000 less than or equal to the median of the US Equity Universe. Products will also have to be in the top 25th percentile ranking for their five year Beta using Russell 1000. Universe is available on both gross and net of fee basis.
PSN RBSA Pure Large Cap Conservative- Includes all US equity products which Large Cap Growth + Large Cap Value style allocation is greater than or equal to 75%. Moreover, products that pass the criteria will also have a five year Tracking Error (sample) calculated using Russell 1000 less than or equal to the median of the US Equity Universe. Products will also have to be in the bottom 25th percentile ranking for their five year Beta using Russell 1000. Universe is available on both gross and net of fee basis.
PSN RBSA Pure Large Cap Moderate- Includes all US equity products which Large Cap Growth + Large Cap Value style allocation is greater than or equal to 75%. Moreover, products that pass the criteria will also have a five year Tracking Error (sample) calculated using Russell 1000 less than or equal to the median of the US Equity Universe. Products will also have to be between the 25th and 75th percentile ranking for their five year Beta using Russell 1000. Universe is available on both gross and net of fee basis.
PSN RBSA Pure Large Cap Growth- Includes all US equity products which Large Cap Growth style allocation is greater than or equal to 75%. Moreover, products that pass the criteria will also have a five year Tracking Error (sample) calculated using Russell 1000 Growth less than or equal to the median of the US Equity Universe. Universe is available on both gross and net of fee basis.
PSN RBSA Pure Large Cap Growth Aggressive- Includes all US equity products which Large Cap Growth style allocation is greater than or equal to 75%. Moreover, products that pass the criteria will also have a five year Tracking Error (sample) calculated using Russell 1000 Growth less than or equal to the median of the US Equity Universe. Products will also have to be in the top 25th percentile ranking for their five year Beta using Russell 1000 Growth. Universe is available on both gross and net of fee basis.
PSN RBSA Pure Large Cap Growth Conservative - Includes all US equity products which Large Cap Growth style allocation is greater than or equal to 75%. Moreover, products that pass the criteria will also have a five year Tracking Error (sample) calculated using Russell 1000 Growth less than or equal to the median of the US Equity Universe. Products will also have to be in the bottom 25th percentile ranking for their five year Beta using Russell 1000 Growth. Universe is available on both gross and net of fee basis.
PSN RBSA Pure Large Cap Growth Moderate- Includes all US equity products which Large Cap Growth style allocation is greater than or equal to 75%. Moreover, products that pass the criteria will also have a five year Tracking Error (sample) calculated using Russell 1000 Growth less than or equal to the median of the US Equity Universe. Products will also have to be in between the 25th and 75th percentile ranking for their five year Beta using Russell 1000 Growth. Universe is available on both gross and net of fee basis.
PSN RBSA Pure Large Cap Value- Includes all US equity products which Large Cap Value style allocation is greater than or equal to 75%. Moreover, products that pass the criteria will also have a five year Tracking Error (sample) calculated using Russell 1000 Value less than or equal to the median of the US Equity Universe. Universe is available on both gross and net of fee basis.
PSN RBSA Pure Large Cap Value Aggressive- Includes all US equity products which Large Cap Value style allocation is greater than or equal to 75%. Moreover, products that pass the criteria will also have a five year Tracking Error (sample) calculated using Russell 1000 Value less than or equal to the median of the US Equity Universe. Products will also have to be in the top 25th percentile ranking for their five year Beta using Russell 1000 Value. Universe is available on both gross and net of fee basis.
PSN RBSA Pure Large Cap Value Conservative- Includes all US equity products which Large Cap Value style allocation is greater than or equal to 75%. Moreover, products that pass the criteria will also have a five year Tracking Error (sample) calculated using Russell 1000 Value less than or equal to the median of the US Equity Universe. Products will also have to be in the bottom 25th percentile ranking for their five year Beta using Russell 1000 Value. Universe is available on both gross and net of fee basis.
PSN RBSA Pure Large Cap Value Moderate- Includes all US equity products which Large Cap Value style allocation is greater than or equal to 75%. Moreover, products that pass the criteria will also have a five year Tracking Error (sample) calculated using Russell 1000 Value less than or equal to the median of the US Equity Universe. Products will also have to be in between the 25th and 75th percentile ranking for their five year Beta using Russell 1000 Value. Universe is available on both gross and net of fee basis.
PSN RBSA Pure Small Cap - Includes all US equity products which Small Cap Value + Small Cap Growth style allocation is greater than or equal to 75%. Moreover, products that pass the criteria will also have a five year Tracking Error (sample) calculated using Russell 2000 less than or equal to the median of the US Equity Universe. Universe is available on both gross and net of fee basis.
PSN RBSA Pure Small Cap Aggressive- Includes all US equity products which Small Cap Value + Small Cap Growth style allocation is greater than or equal to 75%. Moreover, products that pass the criteria will also have a five year Tracking Error (sample) calculated using Russell 2000 less than or equal to the median of the US Equity Universe. Products will also have to be in the top 25th percentile ranking for their five year Beta using Russell 2000. Universe is available on both gross and net of fee basis.
PSN RBSA Pure Small Cap Conservative- Includes all US equity products which Small Cap Value + Small Cap Growth style allocation is greater than or equal to 75%. Moreover, products that pass the criteria will also have a five year Tracking Error (sample) calculated using Russell 2000 less than or equal to the median of the US Equity Universe. Products will also have to be in the bottom 25th percentile ranking for their five year Beta using Russell 2000. Universe is available on both gross and net of fee basis.
PSN RBSA Pure Small Cap Moderate- Includes all US equity products which Small Cap Value + Small Cap Growth style allocation is greater than or equal to 75%. Moreover, products that pass the criteria will also have a five year Tracking Error (sample) calculated using Russell 2000 less than or equal to the median of the US Equity Universe. Products will also have to be in between the 25th and 75th percentile ranking for their five year Beta using Russell 2000. Universe is available on both gross and net of fee basis.
PSN RBSA Pure Small Cap Growth- Includes all US equity products which Small Cap Growth style allocation is greater than or equal to 75%. Moreover, products that pass the criteria will also have a five year Tracking Error (sample) calculated using Russell 2000 Growth less than or equal to the median of the US Equity Universe. Universe is available on both gross and net of fee basis.
PSN RBSA Pure Small Cap Growth Aggressive- Includes all US equity products which Small Cap Growth style allocation is greater than or equal to 75%. Moreover, products that pass the criteria will also have a five year Tracking Error (sample) calculated using Russell 2000 Growth less than or equal to the median of the US Equity Universe. Products will also have to be in the top 25th percentile ranking for their five year Beta using Russell 2000 Growth. Universe is available on both gross and net of fee basis.
PSN RBSA Pure Small Cap Growth Conservative - Includes all US equity products which Small Cap Growth style allocation is greater than or equal to 75%. Moreover, products that pass the criteria will also have a five year Tracking Error (sample) calculated using Russell 2000 Growth less than or equal to the median of the US Equity Universe. Products will also have to be in the bottom 25th percentile ranking for their five year Beta using Russell 2000 Growth. Universe is available on both gross and net of fee basis.
PSN RBSA Pure Small Cap Growth Moderate- Includes all US equity products which Small Cap Growth style allocation is greater than or equal to 75%. Moreover, products that pass the criteria will also have a five year Tracking Error (sample) calculated using Russell 2000 Growth less than or equal to the median of the US Equity Universe. Products will also have to be in between the 25th and 75th percentile ranking for their five year Beta using Russell 2000 Growth. Universe is available on both gross and net of fee basis.
PSN RBSA Pure Small Cap Value- Includes all US equity products which Small Cap Value style allocation is greater than or equal to 75%. Moreover, products that pass the criteria will also have a five year Tracking Error (sample) calculated using Russell 2000 Value less than or equal to the median of the US Equity Universe. Universe is available on both gross and net of fee basis.
PSN RBSA Pure Small Cap Value Aggressive- Includes all US equity products which Small Cap Value style allocation is greater than or equal to 75%. Moreover, products that pass the criteria will also have a five year Tracking Error (sample) calculated using Russell 2000 Value less than or equal to the median of the US Equity Universe. Products will also have to be in the top 25th percentile ranking for their five year Beta using Russell 2000 value. Universe is available on both gross and net of fee basis.
PSN RBSA Pure Small Cap Value Conservative- Includes all US equity products which Small Cap Value style allocation is greater than or equal to 75%. Moreover, products that pass the criteria will also have a five year Tracking Error (sample) calculated using Russell 2000 Value less than or equal to the median of the US Equity Universe. Products will also have to be in the bottom 25th percentile ranking for their five year Beta using Russell 2000 value. Universe is available on both gross and net of fee basis.
PSN RBSA Pure Small Cap Value Moderate- Includes all US equity products which Small Cap Value style allocation is greater than or equal to 75%. Moreover, products that pass the criteria will also have a five year Tracking Error (sample) calculated using Russell 2000 Value less than or equal to the median of the US Equity Universe. Products will also have to be in between the 25th and 75th percentile ranking for their five year Beta using Russell 2000 value. Universe is available on both gross and net of fee basis.
PSN RBSA Pure Value - Includes all US equity products which Large Cap Value + Mid Cap Value + Small Cap Value style allocation is greater than or equal to 75%. Universe is available on both gross and net of fee basis.
PSN RBSA Pure Value Aggressive- Includes all US equity products which Large Cap Value + Mid Cap Value + Small Cap Value style allocation is greater than or equal to 75%. Moreover, products that pass the criteria will also have to be in the top 25th percentile ranking for their five year Beta using Russell 3000 Value. Universe is available on both gross and net of fee basis.
PSN RBSA Pure Value Conservative- Includes all US equity products which Large Cap Value + Mid Cap Value + Small Cap Value style allocation is greater than or equal to 75%. Moreover, products that pass the criteria will also have to be in the bottom 25th percentile ranking for their five year Beta using Russell 3000 Value. Universe is available on both gross and net of fee basis.
PSN RBSA Pure Value Moderate- Includes all US equity products which Large Cap Value + Mid Cap Value + Small Cap Value style allocation is greater than or equal to 75%. Moreover, products that pass the criteria will also have to be in between the 25th and 75th percentile ranking for their five year Beta using Russell 3000 Value. Universe is available on both gross and net of fee basis.
ETF Global balanced - Includes products that invest, in some portion, equities, and fixed income and cash equivalents and are not constrained by any geographic regions. The product should be run as a whole and not a combination of existing equity and fixed income products. It should also meet the following criteria. The criteria are, % in ETF Low should be 50% or more, & or % in ETF High should be 90% or more. Universe is available on both gross and net of fee basis.
ETF Global Equity - Includes all equity products that are not constrained by any geographic regions. Universe is available on both gross and net of fee basis. It should also meet the following criteria. The criteria are, % in ETF Low should be 50% or more, & or % in ETF High should be 90% or more. Universe is available on both gross and net of fee basis.
ETF Global Fixed Income - Includes all fixed income products that are not constrained by any geographic regions. It should also meet the following criteria. The criteria are, % in ETF Low should be 50% or more, & or % in ETF High should be 90% or more. Universe is available on both gross and net of fee basis.
ETF International Balanced - Includes products that invest, in some portion, equities, and fixed income and cash equivalents and are not constrained by any geographic regions. The product should be run as a whole and not a combination of existing equity and fixed income products. It should also meet the following criteria. The criteria are, % in ETF Low should be 50% or more, & or % in ETF High should be 90% or more. Universe is available on both gross and net of fee basis.
ETF International Equity - Includes all equity products which, as policy, do not invest in U.S. equities. It should also meet the following criteria. The criteria are, % in ETF Low should be 50% or more, & or % in ETF High should be 90% or more. Universe is available on both gross and net of fee basis.
ETF US Balanced -Includes products that invest, in some portion, U.S. equities, fixed income and cash equivalents. The product should be run as a whole and not a combination of existing equity and fixed income products. Average asset allocation is generally 60% equity and 40% fixed income. It should also meet the following criteria. The criteria are, % in ETF Low should be 50% or more, & or % in ETF High should be 90% or more. Universe is available on both gross and net of fee basis.
ETF US Equity - Includes all products that invest in any US equity style. It should also meet the following criteria. The criteria are, % in ETF Low should be 50% or more, & or % in ETF High should be 90% or more. Universe is available on both gross and net of fee basis.
ETF US Fixed Income - Includes all products that invest in any US fixed income style. It should also meet the following criteria. The criteria are, % in ETF Low should be 50% or more, & or % in ETF High should be 90% or more. Universe is available on both gross and net of fee basis.
PSN MA Core Fixed Income - Includes US fixed income products that choose core as their primary style objective and Managed Accounts as Product type. Universe is available on both gross and net of fee basis.
PSN MA Global Equity - Includes all Global equity products, and that choose Managed Accounts as their Product type. Universe is available on both gross and net of fee basis.
PSN MA Global/Intl ADR - Includes all Global and International equity products that select “American Depositary Receipt” under Primary style as very important and choose Managed Accounts as Vehicle description. Universe is available on both gross and net of fee basis.
PSN MA Global/Intl Balanced - Includes all Global and International balanced products which choose Managed Accounts as vehicle description. Universe is available on both gross and net of fee basis.
PSN MA Global/Intl TAA - Includes all Global and International Balanced products which select “Tactical Asset Allocation” under Balanced Decision Making as very important and choose Managed Accounts as Vehicle description. Universe is available on both gross and net of fee basis.
PSN MA Intermediate Fixed Income - Includes US fixed income Products that choose Managed Account as product type and intermediate (3-7 years) as their primary maturity. Universe is available on both gross and net of fee basis.
PSN MA International Equity - Includes all International equity products, and that choose Managed Accounts as product type. Universe is available on both gross and net of fee basis.
PSN MA Large Cap Core - Includes US equity products that select Large Capitalization (10-50 billion) or Mega Capitalization (> 50 billion) as their primary market capitalization range, plus Core is chosen as primary style and Managed Accounts as product type. Universe is available on both gross and net of fee basis.
PSN MA Large Cap Equity - Includes US equity products that select Large Capitalization (10-50 billion) or Mega Capitalization (> 50 billion) as their primary market capitalization range and Managed Accounts as their product type. Universe is available on both gross and net of fee basis.
PSN MA Large Cap growth - Includes US equity products that Large Capitalization (10-50 billion) or Mega Capitalization (> 50 billion) as their primary market capitalization range, plus Growth is chosen as primary style and Managed Accounts as Product type. Universe is available on both gross and net of fee basis.
PSN MA Large Cap Value - Includes US equity products that Large Capitalization (10-50 billion) or Mega Capitalization (> 50 billion) as their primary market capitalization range, plus Value is chosen as primary style and Managed Accounts as product type. Universe is available on both gross and net of fee basis.
PSN MA Long Term Fixed Income - Includes US fixed income Products that choose Managed Account as Vehicle description and Long-Term Fixed Income (7-10 years) as their primary maturity. Universe is available on both gross and net of fee basis.
PSN MA Mid Cap Equity- Includes US equity products that select Mid Cap (2 – 10 billion) as their primary market capitalization range and Managed Accounts as product type. Universe is available on both gross and net of fee basis.
PSN MA Mid Cap Growth - Includes US equity products that select Mid Cap (2 –10 billion) as their primary market capitalization range, plus Growth is chosen as primary style and Managed Accounts as product type. Universe is available on both gross and net of fee basis.
PSN MA Municipal Fixed Income - Includes US fixed income products that choose municipals as their primary style objective and Managed Accounts as product type. Universe is available on both gross and net of fee basis.
PSN MA Global/Intl Fixed Income - Includes all Global and International fixed income products which choose Managed Accounts as product type. Universe is available on both gross and net of fee basis.
PSN MA Short Term Fixed Income - Includes US fixed income Products that choose Managed Account as Vehicle description and Short Term Fixed Income (1-3 years) as their primary maturity. Universe is available on both gross and net of fee basis.
PSN MA Small Cap Core - Includes US equity products that select Small Cap (500 million – 2 billion) as their primary market capitalization range, plus Core is chosen as primary style and Managed Accounts as Vehicle Description. Universe is available on both gross and net of fee basis.
PSN MA Small Cap Equity - Includes US equity products that select Small Cap (500 million – 2 billion) as their primary market capitalization range and Managed Accounts as product type. Universe is available on both gross and net of fee basis.
PSN MA Small Cap Growth -: Includes US equity products that select Small Cap (500 million – 2 billion) as their primary market capitalization range, plus Growth is chosen as primary style and Managed Accounts as Vehicle Description. Universe is available on both gross and net of fee basis.
PSN MA Small Cap Value - Includes US equity products that select Small Cap (500 million – 2 billion) as their primary market capitalization range, plus Value is chosen as primary style and Managed Accounts as product type. Universe is available on both gross and net of fee basis.
PSN MA US Balanced - Includes products that invest in U.S. equities and choose Managed Accounts as product type. Universe is available on both gross and net of fee basis.
PSN MA US Core - Includes all products that invest in any US equity, plus Core are chosen as primary style and Managed Accounts as product type. Universe is available on both gross and net of fee basis.
PSN MA US Equity - Includes all products that invest in any US equity, and choose Managed Accounts as product type. Universe is available on both gross and net of fee basis.
PSN MA US Fixed Income - Includes all products that invest in any US fixed income and Managed Accounts as product type. Universe is available on both gross and net of fee basis.
PSN MA US Growth - Includes all products that invest in any US equity, plus Growth are chosen as primary style and Managed Accounts as product type. Universe is available on both gross and net of fee basis.
PSN MA US TAA - Includes all US Balanced products which select “Tactical Asset Allocation” under Balanced Decision Making as “very important” and Managed Accounts as Vehicle Description. Universe is available on both gross and net of fee basis.
PSN MA US Value - Includes all products that invest in any US equity, plus value are chosen as primary style and Managed Accounts as product type. Universe is available on both gross and net of fee basis.
PSN CF Global Equity - Includes all Global equity products, that choose Commingled Fund, Collective Trust or Limited Partnership as their Product type. Universe is available on both gross and net of fee basis.
PSN CF Global/International Balanced - Includes all Global and International Balanced Products that choose Commingled Fund, Collective Trust or Limited Partnership as product type, and products that invest, in some portion, equities, and fixed income and cash equivalents and are not constrained by any geographic regions. The product should be run as a whole and not a combination of existing equity and fixed income products. Universe is available on both gross and net of fee basis.
PSN CF Global/Intl Fixed Income - Includes all International and Global fixed products that choose Commingled Fund, Collective Trust or Limited Partnership as product type. Universe is available on both gross and net of fee basis.
PSN CF Intermediate Fixed Income - Includes Products that invest in any US fixed income style, that choose Commingled Fund, Collective Trust or Limited Partnership as product type and intermediate (3-7 years) as their primary maturity.
PSN CF International Equity - Includes all equity products that choose Commingled Fund, Collective Trust or Limited Partnership as product type, as policy, and which do not invest in U.S. equities. Universe is available on both gross and net of fee basis.
PSN CF Large Cap Core - Includes US equity products that Large Capitalization (10-50 billion) or Mega Capitalization (> 50 billion) as their primary market capitalization range, plus Core is chosen as primary style and Commingled Fund, Collective Trust or Limited Partnership as their Product type. Universe is available on both gross and net of fee basis.
PSN CF Large Cap Equity - Includes US equity products that select Large Capitalization (10-50 billion) or Mega Capitalization (> 50 billion) as their primary market capitalization range and Commingled Fund, Collective Trust or Limited Partnership as their Product type. Universe is available on both gross and net of fee basis.
PSN CF Mid Cap Equity - Includes US equity products that select Mid Cap (2 – 10 billion) as their primary market capitalization range and Commingled Fund, Collective Trust or Limited Partnership as product type. Universe is available on both gross and net of fee basis.
PSN CF Small Cap Equity - Includes US equity products that select Small Cap (500 million – 2 billion) as their primary market capitalization range and Commingled Fund, Collective Trust or Limited Partnership as their product type. Universe is available on both gross and net of fee basis.
PSN CF US Balanced - Includes products that invest, in some portion, U.S. equities, fixed income and cash equivalents. The product should be run as a whole and not a combination of existing equity and fixed income products. Average asset allocation is generally 60% equity and 40% fixed income and choose Commingled Fund, Collective Trust or Limited Partnership as product type. Universe is available on both gross and net of fee basis.
PSN CF US Equity - Includes all products that invest in any US equity and choose Commingled Fund, Collective Trust or Limited Partnership as their product type. Universe is available on both gross and net of fee basis.
PSN CF US Fixed Income - Includes all products that invest in any US fixed income style and that choose Commingled Fund, Collective Trust or Limited Partnership as their product type. Universe is available on both gross and net of fee basis.
PSN MF Global Equity - Includes all Global equity products, that Mutual Fund as their Product type. Universe is available on both gross and net of fee basis.
PSN MF Global/Intl Balanced - Includes all Global and International Balanced Products that choose Commingled Fund, Collective Trust or Limited Partnership as product type, and products that invest, in some portion, equities, and fixed income and cash equivalents and are not constrained by any geographic regions. The product should be run as a whole and not a combination of existing equity and fixed income products. Universe is available on both gross and net of fee basis
PSN MF Global/Intl Fixed Income - Includes all International and Global fixed products that choose Mutual Fund as product type. Universe is available on both gross and net of fee basis.
PSN MF International Equity - Includes all equity products that choose Mutual Fund as product type, as policy, and which do not invest in U.S. equities. Universe is available on both gross and net of fee basis.
PSN MF US Balanced - Includes products that invest, in some portion, U.S. equities, fixed income and cash equivalents. The product should be run as a whole and not a combination of existing equity and fixed income products. Average asset allocation is generally 60% equity and 40% fixed income and choose Mutual Fund as product type. Universe is available on both gross and net of fee basis.
PSN MF US Equity - Includes all products that invest in any US equity, and Mutual Fund as product type. Universe is available on both gross and net of fee basis.
PSN MF US Fixed Income - Includes all products that invest in any US fixed income and Mutual Fund as product type. Universe is available on both gross and net of fee basis
HBEC Broad Cap Equity -Includes all US Equity products apart from those in which the Primary Equity Style is either REIT or Convertibles. Only those products that have provided Weighted Average Market Cap for at least 3 out of the last 4 quarters are included. Weighted Average Market Cap ranges vary from quarter to quarter according to Russell 3000.
HBEC Broad Cap Equity Core -For all the products included in Broad Cap universe, we rank P/B from smallest to largest (Rank 1, 2, 3…).Then we rank P/E Projected 12 months from smallest to largest (Rank 1, 2, 3…). We combine both of these rankings, and rate them from smallest to largest. The products at the mid 30% are assigned as Core. We repeat these calculations for the preceding 4 quarters. Products that are in at least 3 out of the 4 periods in Core are then assigned to the Core universe.
HBEC Broad Cap Equity Growth -For all the products included in Broad Cap universe, we rank P/B from smallest to largest (Rank 1, 2, 3…) then we rank P/E Projected 12 months from smallest to largest (Rank 1, 2, 3…). We combine both of these rankings, and rate them from smallest to largest. The products at the bottom 35% are assigned as Growth. We repeat these calculations for the preceding 4 quarters. Products that are in at least 3 out of the 4 periods in Growth are then assigned to the Growth universe.
HBEC Broad Cap Equity Value - For all the products included in Broad Cap universe, we rank P/B from smallest to largest (Rank 1, 2, 3,…).Then we rank P/E Projected 12 months from smallest to largest (Rank 1, 2, 3…).We combine both of these rankings, and rate them from smallest to largest. The products at the top 35% are assigned as Value. We repeat these calculations for the preceding 4 quarters. Products that are in at least 3 out of the 4 periods in Value are then assigned to the Value universe.
HBEC Large Cap - Includes all US Equity products apart from those in which the Primary Equity Style is either REIT or Convertibles. Only those products that have provided Weighted Average Market Cap for at least 3 out of the last 4 quarters are included. Weighted Average Market Cap ranges vary from quarter to quarter according to the Russell 1000.
HBEC Large Cap Core - For all the products included in the Large Cap Universe, we rank P/B from smallest to largest (Rank 1, 2, 3…). Then we rank P/E Projected for 12 months from smallest to largest (Rank 1, 2, 3 …). We combine both of these rankings, and rate them from smallest to largest. The products at the mid 30% are assigned as Core. We repeat these calculations for the preceding 4 quarters. Products that are in at least 3 out of the 4 quarters in Core are then assigned to the Core Universe.
HBEC Large Cap Growth - For all the products included in the Large Cap Universe, we rank P/B from smallest to largest (Rank 1, 2, 3…). Then we rank P/E Projected for 12 months from smallest to largest (Rank 1, 2, 3 …). We combine both of these rankings, and rate them from smallest to largest. The products at the bottom 35% are assigned as Growth. We repeat these calculations for the preceding 4 quarters. Products that are in at least 3 out of the 4 quarters in Growth are then assigned to the Growth Universe.
HBEC Large Cap Value - For all the products included in the Large Cap Universe, we rank P/B from smallest to largest (Rank 1, 2, 3…). Then we rank P/E Projected for 12 months from smallest to largest (Rank 1, 2, 3 …). We combine both of these rankings, and rate them from smallest to largest. The products at the top 35% are assigned as Value. We repeat these calculations for the preceding 4 quarters. Products that are in at least 3 out of the 4 quarters in Value are then assigned to the Value Universe.
HBEC Mega Cap - Includes all US Equity products apart from those in which the Primary Equity Style is either REIT or Convertibles. Only those products that have provided Weighted Average Market Cap for at least 3 out of the last 4 quarters are included. Weighted Average Market Cap ranges vary from quarter to quarter according to the Russell Top 200.
HBEC Mega Cap Core - For all the products included in the Mega Cap Universe, we rank P/B from smallest to largest (Rank 1, 2, 3…). Then we rank P/E Projected for 12 months from smallest to largest (Rank 1, 2, 3 …). We combine both of these rankings, and rate them from smallest to largest. The products at the mid 30% are assigned as Core. We repeat these calculations for the preceding 4 quarters. Products that are in at least 3 out of the 4 quarters in Core are then assigned to the Core Universe.
HBEC Mega Cap Growth - For all the products included in the Mega Cap Universe, we rank P/B from smallest to largest (Rank 1, 2, 3…). Then we rank P/E Projected for 12 months from smallest to largest (Rank 1, 2, 3 …). We combine both of these rankings, and rate them from smallest to largest. The products at the bottom 35% are assigned as Growth. We repeat these calculations for the preceding 4 quarters. Products that are in at least 3 out of the 4 quarters in Growth are then assigned to the Growth Universe.
HBEC Mega Cap Value - For all the products included in the Mega Cap Universe, we rank P/B from smallest to largest (Rank 1, 2, 3…). Then we rank P/E Projected for 12 months from smallest to largest (Rank 1, 2, 3 …). We combine both of these rankings, and rate them from smallest to largest. The products at the top 35% are assigned as Value. We repeat these calculations for the preceding 4 quarters. Products that are in at least 3 out of the 4 quarters in Value are then assigned to the Value Universe.
HBEC Micro Cap - Includes all US Equity products apart from those in which the Primary Equity Style is either REIT or Convertibles. Only those products that have provided Weighted Average Market Cap for at least 3 out of the last 4 quarters are included. Weighted Average Market Cap ranges vary from quarter to quarter according to Russell Micro Cap.
HBEC Micro Cap Core - For all the products included in Micro Cap universe, we rank P/B from smallest to largest (Rank 1, 2, 3…).Then we rank P/E Projected 12 months from smallest to largest (Rank 1, 2, 3…). We combine both of these rankings, and rate them from smallest to largest. The products at the mid 30% are assigned as Core. We repeat these calculations for the preceding 4 quarters. Products that are in at least 3 out of the 4 periods in Core are then assigned to the Core universe.
HBEC Micro Cap Growth -For all the products included in Micro Cap universe, we rank P/B from smallest to largest (Rank 1, 2, 3…).Then we rank P/E Projected 12 months from smallest to largest (Rank 1, 2, 3 …). We combine both of these rankings, and rate them from smallest to largest. The products at the bottom 35% are assigned as Growth. We repeat these calculations for the preceding 4 quarters. Products that are in at least 3 out of the 4 periods in Growth are then assigned to the Growth universe.
HBEC Micro Cap Value - For all the products included in Micro Cap universe, we rank P/B from smallest to largest (Rank 1, 2, 3…). Then we rank P/E Projected 12 months from smallest to largest (Rank 1, 2, 3 …). We combine both of these rankings, and rate them from smallest to largest. The products at the top 35% are assigned as Value. We repeat these calculations for the preceding 4 quarters. Products that are in at least 3 out of the 4 periods in Value are then assigned to the Value universe.
HBEC Mid Cap - Includes all US Equity products apart from those in which the Primary Equity Style is either REIT or Convertibles. Only those products that have provided Weighted Average Market Cap for at least 3 out of the last 4 quarters are included. Weighted Average Market Cap ranges vary from quarter to quarter according to the Russell Mid Cap.
HBEC Mid Cap Core - For all the products included in Mid Cap universe, we rank P/B from smallest to largest (Rank 1, 2, 3…). Then we rank P/E Projected 12 months from smallest to largest (Rank 1, 2, 3 …).We combine both of these rankings, and rate them from smallest to largest. The products at the mid 30% are assigned as Core. We repeat these calculations for the preceding 4 quarters. Products that are in at least 3 out of the 4 periods in Core are then assigned to the Core universe.
HBEC Mid Cap Growth - For all the products included in Mid Cap Universe, we rank P/B from smallest to largest (Rank 1, 2, 3…). Then we rank P/E Projected for 12 months from smallest to largest (Rank 1, 2, 3 …). We combine both of these rankings, and rate them from smallest to largest. The products at the bottom 35% are assigned as Growth. We repeat these calculations for the preceding 4 quarters. Products that are in at least 3 out of the 4 quarters in Growth are then assigned to the Growth Universe.
HBEC Mid Cap Value - For all the products included in Mid Cap universe, we rank P/B from smallest to largest (Rank 1, 2, 3…). Then we rank P/E Projected 12 months from smallest to largest (Rank 1, 2, 3 …). We combine both of these rankings, and rate them from smallest to largest. The products at the top 35% are assigned as Value. We repeat these calculations for the preceding 4 quarters. Products that are in at least 3 out of the 4 periods in Value are then assigned to the Value universe.
HBEC Small Cap - Includes all US Equity products apart from those in which the Primary Equity Style is either REIT or Convertibles. Only those products that have provided Weighted Average Market Cap for at least 3 out of the last 4 quarters are included. Weighted Average Market Cap ranges vary from quarter to quarter according to Russell 2000.
HBEC Small Cap Core - For all the products included in Small Cap universe, we rank P/B from smallest to largest (Rank 1, 2, 3…).Then we rank P/E Projected 12 months from smallest to largest (Rank 1, 2, 3 …). We combine both of these rankings, and rate them from smallest to largest. The products at the mid 30% are assigned as Core. We repeat these calculations for the preceding 4 quarters. Products that are in at least 3 out of the 4 periods in Core are then assigned to the Core universe.
HBEC Small Cap Growth - For all the products included in Small Cap universe, we rank P/B from smallest to largest (Rank 1, 2, 3…).Then we rank P/E Projected 12 months from smallest to largest (Rank 1, 2, 3…).We combine both of these rankings, and rate them from smallest to largest. The products at the bottom 35% are assigned as Growth. We repeat these calculations for the preceding 4 quarters. Products that are in at least 3 out of the 4 periods in Growth are then assigned to the Growth universe.
HBEC Small Cap Value - For all the products included in Small Cap universe, we rank P/B from smallest to largest (Rank 1, 2, 3…).Then we rank P/E Projected 12 months from smallest to largest (Rank 1, 2, 3 …). We combine both of these rankings, and rate them from smallest to largest. The products at the top 35% are assigned as Value. We repeat these calculations for the preceding 4 quarters. Products that are in at least 3 out of the 4 periods in Value are then assigned to the Value universe.
HBEC SMid Cap - Includes all US Equity products apart from those in which the Primary Equity Style is either REIT or Convertibles. Only those products that have provided Weighted Average Market Cap for at least 3 out of the last 4 quarters are included. Weighted Average Market Cap ranges vary from quarter to quarter according to Russell 2500.
HBEC SMid Cap Core - For all the products included in SMid Cap universe, we rank P/B from smallest to largest (Rank 1, 2, 3…). Then we rank P/E Projected 12 months from smallest to largest (Rank 1, 2, 3 …).We combine both of these rankings, and rate them from smallest to largest. The products at the mid 30% are assigned as Core. We repeat these calculations for the preceding 4 quarters. Products that are in at least 3 out of the 4 periods in Core are then assigned to the Core universe.
HBEC SMid Cap Growth - For all the products included in SMid Cap universe, we rank P/B from smallest to largest (Rank 1, 2, 3…).Then we rank P/E Projected 12 months from smallest to largest (Rank 1, 2, 3 …). We combine both of these rankings, and rate them from smallest to largest. The products at the bottom 35% are assigned as Growth. We repeat these calculations for the preceding 4 quarters. Products that are in at least 3 out of the 4 periods in Growth are then assigned to the Growth universe.
HBEC SMid Cap Value - For all the products included in SMid Cap universe, we rank P/B from smallest to largest (Rank 1, 2, 3…). Then we rank P/E Projected 12 months from smallest to largest (Rank 1, 2, 3 …). We combine both of these rankings, and rate them from smallest to largest. The products at the top 35% are assigned as Value. We repeat these calculations for the preceding 4 quarters. Products that are in at least 3 out of the 4 periods in Value are then assigned to the Value universe.
www.barclayhedge.com/products/list-of-hedge-funds.html
http://morningstardirect.morningstar.com/clientcomm/CategoryDefinitions_EAA_Ver8.4_2014.pdf
www.global.morningstar.com/MorningstarCategories
Morningstar Disclaimers:
http://corporate.morningstar.com/US/asp/detail.aspx?xmlfile=372.xml
40% S&P 500/60% Barclays Govt Credit - This blended index is composed 40% of the Standard & Poor's 500 Index and 60% of the Barclays Capital Government/Credit Bond Index rebalanced monthly.
50% S&P 500/50% Barclays Govt Credit - This blended index is composed of 50% of the Standard and Poor's 500 Index and 50% of the Barclays Capital Government/Credit Bond Index rebalanced monthly.
60% MSCI EAFE/40% CG World Govt - This blended index is composed of 60% of the MSCI EAFE Gross of Fees and 40% of the Citigroup World Government Bond Index rebalanced monthly.
60% MSCI World/40% CG World Govt - This blended index is composed of 60% of the MSCI World Gross and 40% of the Citigroup World Government Bond Index rebalanced monthly.
60% S&P 500/40% Barclays Int Govt Credit - This blended index is composed of 60% of the Standard & Poor's 500 Index with income and 40% of the Barclays Capital International Government/Credit Bond Index rebalanced monthly.
60% S&P 500/40% Barclays Govt Credit- This blended index is composed of 60% of the Standard & Poor's 500 Index with income and 40% of the Barclays Capital Government/Credit Bond Index rebalanced monthly.
60% S&P 500/40% Barclays US AGG - This blended index is composed of 60% of the Standard & Poor's 500 Index with income and 40% of the Barclays Capital US Aggregate Bond Index rebalanced monthly.
90 Day U.S. Treasury Bills - Ninety day U.S. Treasury Bills are the safest and most liquid investment next to cash. Treasury bills are short-term direct obligations of the U.S. Government and are issued with maturities of three months. Bills are offered in bearer form and therefore cannot be registered in any legal name. Bills do not bear a stated interest rate. The interest is calculated by taking the difference between the discount price, date of purchase and the face amount (par) collected at maturity. The yield is figured on a 360 day basis, versus 365 days for interest bearing securities, using the actual number of days remaining in the life of the issue.
Alerian Infrastructure MLP Index - The Alerian MLP Infrastructure Index provides an enhanced liquid subset of the Alerian MLP Index that includes only midstream energy transportation and storage assets, and selects those companies that are infrastructure hard-asset focused. The index provides greater diversification and specific exposure to infrastructure investment.
Alerian MLP Index - The Alerian MLP Index (NYSE: AMZ) provides a comprehensive benchmark for investors to track the performance of the 50 most prominent energy master limited partnership sector. The index is calculated and maintained by Standard & Poor’s based on Standard & Poor’s standardized proprietary methodology in consultation with Alerian Capital Management for application to the Master Limited Partnership asset class.
www.barclayhedge.com/research/indices
https://index.barcap.com/Home/Guides_and_Factsheets
BNY Mellon ADR Total Return- BNY Mellon ADR Index tracks all Depositary Receipts traded on The New York Stock Exchange (NYSE), NYSE Amex and NASDAQ. It is calculated on a continuous basis throughout the trading day. BNY Mellon ADR Index is capitalization-weighted and adjusted for free-float utilizing Dow Jones' current methodology.
BNY Mellon Classic ADR Total Return - BNY Mellon Classic ADR Index tracks all Depositary Receipts either traded OTC or on The New York Stock Exchange (NYSE), NYSE Amex or NASDAQ. The index is capitalization-weighted and adjusted for free-float utilizing Dow Jones' current methodology.
BNY Mellon DR Total Return- BNY Mellon DR Index tracks all American and global DRs traded on The London Stock Exchange, the New York Stock Exchange, NYSE Amex and NASDAQ, it is an ideal benchmarking tool for ADR and GDR investors alike. Calculated on a continuous basis throughout the trading day - beginning with the open of the U.K. market through the close of the U.S. market - BNY Mellon DR Index is capitalization-weighted and adjusted for free-float using Dow Jones' methodology.
BNY Mellon GDR Total Return -BNY Mellon GDR Index tracks all GDRs traded on The London Stock Exchange. The index is calculated on a continuous basis throughout the trading day - beginning with the open of the U.K. market through its close. The index is capitalization-weighted and adjusted for free-float using Dow Jones' methodology.
Calvert Social Index - Calvert, a leader in socially responsible investing, has created the Calvert Social Index TM, as a broad-based, rigorously constructed benchmark for measuring the performance of US-based socially responsible companies. Calvert starts by taking the 1,000 largest companies in the US, representing stocks listed on the NYSE and NASDAQ-AMEX (not including closed-end mutual funds, ADRs, REITS and non-common shares); and ranks them in descending order based on their float-adjusted market capitalization.
Cambridge US Private Equity & US Venture Capital Index
https://www.cambridgeassociates.com/benchmarks/
Please email: fi.index@citi.com for a copy of the latest indices or Register at https://www.yieldbook.com/x/fiindex for the latest update.
Consumer Price Index - The Consumer Price Index, published by the Commerce Department, is the name given to the series of numbers whose ratios measure the relative prices at various times of a selected group of goods and services which typify those bought by urban families. The CPI in PSN is the CPI-U for all urban consumers calculated with 1982 to 1984 as the base period and is not seasonally adjusted.
Counter Bond Index - The Counter Bond Index ("CBI") is the first index in existence to measure the performance of the Trust Interest-Only Mortgage securities market.
http://www.djindexes.com./targetdate/?go=literature
The Dow Jones Target Date Indexes were created to benchmark portfolios of stocks, bonds and cash. Each index is made up of composite indexes representing these three asset classes. The asset class indexes are weighted differently within each target date index depending on the time horizon. Each month, the allocations among the asset class indexes are rebalanced to reflect an increasingly conservative asset mix.
The Dow Jones Target Date Index family currently includes global and U.S. indexes with target rates extending through 2055. New indexes are expected to be added in five-year increments.
Currently available are global and U.S. series, for target dates extending through 2055:
Global Series U.S. Series
Dow Jones Target Today Index Dow Jones U.S. Target Today Index
Dow Jones Target 2005 Index Dow Jones U.S. Target 2005 Index
Dow Jones Target 2010 Index Dow Jones U.S. Target 2010 Index
Dow Jones Target 2015 Index Dow Jones U.S. Target 2015 Index
Dow Jones Target 2020 Index Dow Jones U.S. Target 2020 Index
Dow Jones Target 2025 Index Dow Jones U.S. Target 2025 Index
Dow Jones Target 2030 Index Dow Jones U.S. Target 2030 Index
Dow Jones Target 2035 Index Dow Jones U.S. Target 2035 Index
Dow Jones Target 2040 Index Dow Jones U.S. Target 2040 Index
Dow Jones Target 2045 Index Dow Jones U.S. Target 2045 Index
Dow Jones Target 2050 Index Dow Jones U.S. Target 2050 Index
Dow Jones Target 2055 Index Dow Jones U.S. Target 2055 Index
www.globalpropertyresearch.com
https://www.hedgefundresearch.com/indices
Primary Strategy Descriptions Strategy: In completing a fund profile for inclusion in HFR subscriber database, an investment manager qualitatively chooses one of four primary strategies, as defined below:
ED
Event-Driven: Investment Managers who maintain positions in securities of companies currently or prospectively involved in corporate transactions of a wide variety, including but not limited to: mergers, restructurings, financial distress, tender offers, shareholder buybacks, debt exchanges, security issuance or other capital structure adjustments. Security types can range from most senior in the capital structure to most junior or subordinated, and frequently involve additional derivative securities. ED exposure contains a combination of sensitivities to equity markets, credit markets and idiosyncratic, company specific developments. Investment theses are typically predicated on fundamental characteristics (as opposed to quantitative), with the realization of the thesis predicated on a specific development exogenous to the existing capital structure.
EH
Equity Hedge: Equity Hedge strategies maintain positions both long and short in primarily equity and equity derivative securities. A wide variety of investment processes can be employed to arrive at an investment decision, including both quantitative and fundamental techniques; strategies can be broadly diversified or narrowly focused on specific sectors and can range broadly in terms of levels of net exposure, leverage employed, holding period, concentrations of market capitalizations and valuation ranges of typical portfolios. Equity Hedge managers would typically maintain at least 50%, and may in some cases be substantially entirely invested in equities, both long and short.
FOF
Fund of Funds: Fund of Funds invest with multiple managers through funds or managed accounts. The strategy designs a diversified portfolio of managers with the objective of significantly lowering the risk (volatility) of investing with an individual manager. The Fund of Funds manager has discretion in choosing which strategies to invest in for the portfolio. A manager may allocate funds to numerous managers within a single strategy, or with numerous managers in multiple strategies. The minimum investment in a Fund of Funds may be lower than an investment in an individual hedge fund or managed account. The investor has the advantage of diversification among managers and styles with significantly less capital than investing with separate managers.
M
Macro: Investment Managers which execute a broad range of strategies in which the investment process is predicated on movements in underlying economic variables and the impact these have on equity, fixed income, currency and commodity markets. Managers employ a variety of techniques, both discretionary and systematic analysis, combinations of top down and bottom up theses, quantitative and fundamental approaches and long and short term holding periods. Although some strategies employ RV techniques, Macro strategies are distinct from RV strategies in that the primary investment thesis is predicated on future movements in the underlying instruments, rather than realization of a valuation discrepancy between securities. In a similar way, while both Macro and equity hedge managers may hold equity securities, the overriding investment thesis is predicated on the impact movements in underlying macroeconomic variables may have on security prices, as opposes to EH, in which the fundamental characteristics on the company are the most significant and integral to investment thesis.
RV
Relative Value: Investment Managers who maintain positions in which the investment thesis is predicated on realization of a valuation discrepancy in the relationship between multiple securities Manager employ a variety of fundamental and quantitative techniques to establish investment theses, and security types range broadly across equity, fixed income, derivative or other security types. RVA position may be involved in corporate transactions also, but as opposed to ED exposures, the investment thesis is predicated on realization of a pricing discrepancy between related securities, as opposed to the outcome of the corporate transaction.
Categories - Funds are classified as either Institutional or Retail. Depending whether the fund is marketed to individuals or institutions (corporations, banks, pension plans/fiduciaries, etc.). A minimum initial investment of $100,000 or more normally classifies a fund as institutional, but we also consider whether the fund is open to individuals. iMoneyNet then classifies funds according to portfolio holdings.
Taxable categories include: First Tier Institutional, First Tier Retail, Government (All), Government Retail, Govt & Agency Institutional, Govt & Agency Retail, Govt Institutional, Prime (All), Prime Institutional, Prime Retail, Second Tier Institutional, Second Tier Retail, Taxable (All), Taxable Institutional, Taxable Retail, Treas & Repo Retail, Treasury & Repo Institutional, Treasury Institutional and Treasury Retail.
Prime - Indicates that the securities are considered to be of either the highest credit quality by at least one nationally recognized statistical rating organization (NRSRO), or that the securities have received the highest rating from one NRSRO and the second highest rating from another, or have received the second highest rating from two NRSROs. "First Tier" securities, as defined by Rule 2a-7 of the Investment Company Act of 1940, are securities rated in the highest short-term rating category by one or more NRSROs (Standard & Poor’s, Moody's Investors Service, or Fitch Ratings).
Taxable (All)
Gov't (All) Category -includes all retail and institutional government-only money funds: Treasury Retail and Treasury Institutional, Treasury & Repo Retail and Treasury & Repo Institutional, Government & Agencies Retail and Government & Agencies Institutional.
Gov't Institutional- Category includes all government institutional funds: Treasury Institutional, Treasury & Repo Institutional, and Government & Agencies Institutional.
Gov't & Agency Institutional - Category includes the most broadly based of the government institutional funds. These funds may invest in U.S. Treasury securities, securities issued or guaranteed by the U.S. Government or its agencies or instrumentalities.
Treasury & Repo Institutional - Category includes institutional funds that may invest in U.S. Treasury securities and repurchase agreements backed by the U.S. Treasury.
Treasury Institutional - Category includes institutional funds that may invest in U.S. Treasury securities which include Treasury Bills, Treasury Notes and Treasury Bonds.
Gov't Retail Category - includes all government retail funds: Treasury Retail, Treasury & Repo Retail, and Government &Agencies Retail.
Gov't & Agency Retail - Category includes the most broadly based of the government retail funds. These
funds may invest in U.S. Treasury securities, securities issued or guaranteed by the U.S. Government or
its agencies or instrumentalities.
Treasury & Repo Retail - Category includes retail funds that may invest in U.S. Treasury securities and
repurchase agreements backed by the U.S. Treasury.
Treasury Retail - Category includes retail funds that may invest in U.S. Treasury securities which include Treasury Bills, Treasury Notes and Treasury Bonds.
Prime (All) Category - includes funds in the First Tier Retail, First Tier Institutional, Second Tier Retail, and Second Tier Institutional categories.
Prime Institutional - Category consists of all funds in the First Tier Instit. and Second Tier Instit. categories.
First Tier Institutional - Category includes institutional funds that may invest in certificates of deposit, time deposits, bankers’ acceptances and other short-term obligations issued by domestic banks, foreign subsidiaries or foreign branches of domestic banks, domestic and foreign branches of foreign banks and other banking institutions, commercial paper, floating and variable rate demand notes and bonds, and asset backed securities.
Second Tier Institutional - Category consists of institutional funds that are holding one to five percent of “Second Tier” securities, as defined by Rule 2A-7.
Prime Retail Category - includes all funds in the First Tier Retail and Second Tier Retail categories.
First Tier Retail- Category includes retail funds that may invest in certificates of deposit, time deposits, bankers’ acceptances and other short term obligations issued by domestic banks, foreign subsidiaries or foreign branches of domestic banks, domestic and foreign branches of foreign banks and other banking institutions, commercial paper, floating and variable rate demand notes and bonds, and asset-backed securities.
Second Tier Retail - Category consists of retail funds that are holding one to five percent or more of “Second Tier” securities, as defined by Rule 2A-7.
Taxable (All) - Category includes all taxable retail and institutional money funds. Consists of funds in the Treasury Retail, Treasury Institutional, Treasury & Repo Retail, Treasury & Repo Institutional, Government & Agency Retail, Government & Agency Institutional, First Tier Retail, First Tier Institutional, Second Tier Retail, and Second Tier Institutional categories.
Taxable Institutional - Category includes all government and prime institutional funds. Consists of funds in the Treasury Institutional, Treasury & Repo Institutional, Government & Agency Institutional, First Tier Institutional, and Second Tier Institutional categories.
Taxable Retail - Category includes all government and prime retail funds. Consists of funds in the Treasury Retail, Treasury & Repo Retail, Government & Agencies Retail, First Tier Retail, and Second Tier Retail categories.
Tax-Free categories include: T-F National Inst, T-F National Retail, T-F State Institutional, T-F State Retail, Tax-Free Institutional, Tax-Free (All), Tax-Free National, Tax-Free Retail and Tax-Free State.
Tax-Free (All)
• Tax-Free National Institutional- Category includes institutional funds that invest in tax-exempt obligations, including state and municipal authorities.
• Tax-Free National Retail- Category includes retail funds that invest in obligations of tax-exempt entities, including state and municipal authorities
• Tax-Free State Institutional - Category includes institutional funds that invest at least 80% in tax-exempt obligations of a single state.
• Tax-Free State Retail- Category includes retail funds that invest at least 80% in tax-exempt obligations of a single state.
Tax Free Institutional - Category includes all institutional national, state tax-free and municipal money funds.
Tax-Free National - Category includes all Tax-Free National Retail and Tax-Free National Institutional funds.
Tax-Free Retail - Category includes all Tax-Free National Retail and Tax-Free State Retail funds.
Tax-Free State -Category includes all Tax-Free State Retail and Tax-Free State Institutional funds.
FILTERS - “AAA” - Rating - This filter selects funds that are AAA rated by any agency.
User must sign up. Once entered, scroll to the bottom right; Click on Index Rules & Defs
NOTES FOR DUPLICATES IN MSCI:
The GICS standard has 4 levels, sectors > industry groups > industries > sub-industries. So in case of an energy (and a few others) there is an energy sector and then an energy industry group. Since the energy sector is not split on the industry group level the two have the exact same stocks as constituents, hence why they have the same returns. Now if in the future, the GICS standard is changed to have more than just the energy industry group then this will not be the case anymore and the returns going forward will not match at that point.:
Here is some more information about GICS if you are interested: https://www.msci.com/gics
NAREIT All Equity - NAREIT stands for the National Association of Real Estate Investment Trusts, a trade organization focused on REITs. For investors, NAREIT publishes information and performance data related to REITs. This NAREIT data can also be useful to other real estate investors as a proxy for the current attractiveness of specific real estate sectors. NARIET does show that equity REIT performance has historically been favorable relative to some other asset equity investments, such as the S&P 500. For REIT managers, NARIET publishes guidelines on performance reporting. For accountants, NAREIT provides commentary on REIT-specific accounting issues.
NASDAQ - It is a measure of all NASDAQ National Market System (NASDAQ/NMS) issues, exclusive of warrants, and all domestic common stocks traded in the regular NASDAQ markets which are not part of the NASDAQ/NMS. The NASDAQ Composite Index is market value weighted. The representation of each security in the Index is proportional to its last sale price (NASDAQ/NMS) or bid price (regular NASDAQ) times the total number of shares outstanding, relative to the total market value of the Index. Income generated from the issues comprising the Index is not reinvested.
NASDAQ-100 Index - The NASDAQ-100 Index includes 100 of the largest domestic and international non-financial securities listed on The NASDAQ Stock Market based on market capitalization. The Index reflects companies across major industry groups including computer hardware and software, telecommunications, retail/wholesale trade and biotechnology. It does not contain securities of financial companies including investment companies. The NASDAQ-100 Index is calculated under a modified capitalization-weighted methodology.
NCREIF National Property Index - a real estate index that includes both all equity properties plus all properties which have been de-leveraged making it a large universe of properties.
Payden & Rygel 1 Year Treasury Note - The Payden &Rygel 1YR measures the return on U.S. Treasury Notes with a maturity of 1 year. Treasury notes are readily marketable obligations of the U.S. Treasury and are issued at par in coupon form. They pay interest semi-annually and are guaranteed as to principal and interest payments by the United States Government. The Payden & Rygel 1 Year Treasury Note Index includes initial yield but also accounts for changes in the market value of these securities.
Payden & Rygel 180 Day Treasury Bill - The PR 180 Day measures the total return on U.S. Treasury Bills with a maturity of 180 days U.S. Treasury Bills are the safest and most liquid investment next to cash and are short term direct obligations of the government. PR180 Day includes the initial yield on these bills but also accounts for changes in the market value of these securities.
Payden & Rygel 2 Year Treasury Note - The PR2YR is basically the same as the Payden & Rygel 1 Year Index except that the Payden & Rygel 2 Year measures the return on U.S. Treasury Notes with a maturity of 2 years.
Ryan Labs 3 Year GIC – Ryan labs 3 year GIC is a composite of market rates of $1 million Guaranteed Investments Contracts held for 3 years and representative of an unmanaged, diversified investment grade portfolio of contracts.
Ryan Labs 5 Year GIC – The Ryan 5-Year GIC Index is a stable value benchmark calculated from the rolling yields on a hypothetical portfolio of high quality Guaranteed Investment Contracts. This index has duration of 2.5 years. The returns of the index are provided as a proxy for stable value returns. At present, there are no widely accepted benchmark indices representing the returns of wrapped fixed income investments.
PSN M-Class Indices - are derived using median performance results and include separate accounts, as opposed to mutual funds, hedge funds, REIT, etc. A product must have at least one-year track record. Products must meet the PSN database registration and reporting requirement for inclusion into any index. To protect against survivor bias, all active, inactive, and terminated products are included. All index performance results are calculated using representative composite performance numbers provided by the investment management companies. Members in each index are derived using a qualified universe crafted by IIS. Each index is calculated on a quarterly basis. Returns prior to 12/31/2001 were back-filled to create historical performance results using data provided as of 2/15/02. Each quarter thereafter, the performance return is calculated six weeks after quarter end. Index inception date is constrained by a minimum of 50 qualified products. The list of members in each index may be modified on a quarterly basis to reflect new entrants and products that no longer meet the requirements.
PSN E-Class Indices - are derived using equal weighted performance results and include separate accounts, as opposed to mutual funds, hedge funds, REIT, etc. A product must have at least one-year track record. Products must meet the PSN database registration and reporting requirement for inclusion into any index. To protect against survivor bias, all active, inactive, and terminated products are included. All index performance results are calculated using representative composite performance numbers provided by the investment management companies. Members in each index are derived using a qualified universe crafted by IIS. Each index is calculated on a quarterly basis. Returns prior to 12/31/2001 were back-filled to create historical performance results using data provided as of 2/15/02. Each quarter thereafter, the performance return is calculated six weeks after quarter end. Index inception date is constrained by a minimum of 50 qualified products. The list of members in each index may be modified on a quarterly basis to reflect new entrants and products that no longer meet the requirements.
TOPIX Composite (Tokyo Stock Price Index) - Commonly called TOPIX. A major indexon the Tokyo Stock Exchange (TSE) that tracks the First Section, which consists of the largest companies by market capitalization. The TOPIX composite includes domestic common stocks, domestic classified stocks, foreign stocks with exclusive listings on the TSE, and domestic preferred equity contribution securities listed on the TSE First Section. This capitalization-weighted index lists all firms that are considered to be under the 'first section' on the TSE, which groups all of the large firms on the exchange into one pool. The second section groups all of the remaining smaller firms. Currently, about 1,600 first section companies are listed on the Tokyo Stock Exchange (TSE), along with 500 second section companies. TOPIX is considered a major indicatorof the state of Japanese investment, and of the economyat large.
Toronto Stock Exchange 300 $CDN - This index includes the top 300 stocks in the Toronto Stock Exchange, ranked by their one year average float quoted market value (QMV). The list of stocks included in the top 300 represents 14 industry sectors and is redefined annually. For a company's shares to be included in the index, the company must be Canadian incorporated and must have been listed on the Toronto Stock Exchange for at least one year. Trading volume of each stock in the index must have been at least 100,000 shares with 100 transactions for the previous year and their trading value must have been at least $1 million. The returns are provided in Canadian dollars. This index is calculated by Vestek, not by the Toronto Stock Exchange. While in most cases the TSE 300 returns will closely track those calculated by Toronto Stock Exchange, it is not guaranteed that they will match exactly for every time period. Inception: 1977; however, PSN history begins December 1990.
Toronto Stock Exchange 300 in $US - This index includes the top 300 stocks in the Toronto Stock Exchange, ranked by their one year average float quoted market value (QMV). The list of stocks included in the top 300 represents 14 industry sectors and is redefined annually. For a company's shares to be included in the index, the company must be Canadian incorporated and must have been listed on the Toronto Stock Exchange for at least one year. Trading volume of each stock in the index must have been at least 100,000 shares with 100 transactions for the previous year and their trading value must have been at least $1 million. The returns have been converted to US dollars. Inception: 1977; however, PSN history begins December 1990.
https://wilshire.com/indexinfo/
This section contains all reports and graphs available from Informa Investment Solutions. Based on your level of PSN Enterprise subscription, some of them may not be available to you. Please contact Informa Investment Solutions client services at clientservices@informais.com for further details.
Best & Worst Performers - The Best and Worst report is used to show the highest and lowest performers in a selected universe. The user selects the date range, the statistic and the number of products to show in the report (For example, the 25 highest and lowest performers for 5 years rate of return). The report will list the 25 highest performers and the 25 lowest performers in the selected universe for a5 year rate of return.
Capture Ratio Trend Analysis - The Capture Ratio Trend analysis graph measures the market shares captured by a product; it further reveals the market trend of the selected product to show the capture ratio pattern of the product relative to a market index. Similar to the risk return graph, this graph is broken down into 4 quadrants relative to the upside to downside capture ratio instead of risk and return. The 100% capture ratio of the up market and the down market determines the intersection of the quadrants. The graph indicates the number of up quarters, return of the portfolio in an up market, return of the market index in an up market, percent of market capture in an up market, number of down quarters, return of the portfolio in a down market, return of the market index in a down market, and percent of market capture in a down market.
Correlation Matrix - The Correlation Matrix report allows the user to determine which combination of managers/products will best complement each other. The system calculates the similarities (or differences) of two or more sets of returns in matrix form.
A positive correlation (between two managers) approaching + 1.00 (the range is from +1.00 to -1.00) indicates a strong similarity in performance results and is interpreted as identifying a strong similarity in investment styles. By selecting two managers with a low or negative correlation, you can produce a portfolio that has a lower risk than those of the individual managers while retaining their combined rewards.
Cumulative Excess - Similar to the Cumulative Performance graph except it deals with the excess return.
Distribution Threshold - The Distribution Threshold report allows the user to identify the break point for the universe based on an x tile. The x can represent any percentage (I.e. If x = 4, x represents a quartile breakdown; If x = 10, x represents a decimal breakdown, and if x = 100, x represents a percentile breakdown.)
Efficient Frontier - This graph is generated with saved hybrid. This graph shows the efficient frontier curve (relative to the members in the saved hybrid) vs. the current allocation of the saved hybrid.
Equity Characteristics - This bar graph shows the breakdown of equity characteristics from equity holdings investment managers provide to PSN. The equity characteristics available are: Beta (5 yr), Dividend Yield, 5 Year EPS Growth, Price/Book, P/E (Projected next 12 months), Return on Equity, Debt/Equity, Annualized Fiscal Y-T-D Turnover and TSEC 30 Day – Yield.
Equity Industry Breakdown - This bar graph shows the break down in percentage the industry sectors. All industry sectors are from equity holdings investment managers provided to PSN. The industry breakdowns available are: Materials, Energy, Consumer Staples, Consumer Discretionary, Industrials, Utility, Healthcare, Information Technology, Telecommunications, Financial, Cash and Other.
Excess Performance - The Excess Performance graph gives users the ability to study multiple funds relative to a benchmark portfolio or market index. It shows the excess rates of return for selected funds over the selected benchmark portfolio or market index as a quarterly or monthly line series for the longest selected time period.
Excess Performance Bar - The Excess Performance Bar graph gives users the ability to study multiple funds relative to a benchmark portfolio or market index. It shows the excess rates of return for selected funds over the selected benchmark portfolio or market index in a bar format for different selected periods.
Excess Risk Reward - The Excess Risk Reward graph is used to compare the excess performance and excess risk (tracking error) of selected managers against the excess performance and excess risk of a market index for a specific period of time. The graph is broken down into 4 quadrants: Less Risk-Less Return, Less Risk-More Return, More Risk-More Return, and More Risk-Less Return. The risk index determines the intersection of the quadrants. In addition to the excess rate of return and tracking error, the analysis also calculates optional risk statistics such as information ratio, alpha, and r-squared.
Executive Summary – The Executive Summary report is two-page summary containing vital information about the firm and a product. Information includes: contact information, fees, assets, investment styles, decision making process, equity holdings, fixed income maturity, personnel information, wrap/tamp offering information, performance, MPT statistics, growth of $1000 graph line, excess rate of return bar graph, quartile ranking graph, and risk reward graph.
Executive Summary II – The Executive Summary II report is two-page summary containing vital information about the firm and a product. Information includes: contact information, fees, assets, investment styles, decision making process, equity holdings, fixed income maturity, personnel information, wrap/tamp offering information, performance, MPT statistics, growth of $1000 bar graph, rate of return bar graph, cumulative excess rate of return line graph, and historical return distribution ranking graph.
Firm Assets - Client Type – The Firm Assets - Client Type report contains different asset break down by type of clients invested in the manager, i.e. corporate, public, taxable, tax-exempt, etc.
Firm Data – This is the primary firm data profile of the system containing every data field collected by Informa Investment Solutions grouped in various sections:
Contact Information
Firm Ownership
Compliance
Pending Litigation & Liability Insurance
Assets and Accounts by Client Type
Assets and Accounts by Client Size
Assets and Accounts by Geographical Scope
Assets and Account by Asset Class
Accounts Gained and Lost
Representative Client List
Personnel Summary & Turnover
Product Offered
Firm Narrative – This is the primary firm narrative of the system written by the manager and containing the following sections:
Organization and Ownership
Product Offering and Services
Business Objectives and Strategy
Executive Professionals and Biographies
Firm – Profile - This report will display firm information for the selected investment manager (the PSN client selects at the Selection screen in PSN): Asset Flow Analysis, Distribution of Assets by Style, Source of Asset Growth, Performance Analysis and Product Analysis. Note: See Appendix C/Firm – Profile/Detailed Break-down
Firm Summary - The Firm Summary report contains basic contact, asset, account, and personnel information.
Firm – Top 100 Net Flows - This report will display the ranking of the Top 100 asset management firms by Flow. It provides asset size as summed by products reported to the PSN database and market share of the PSN Market Place. The top 100 firms are represented here.
Growth of an Investment - The Growth of the Dollar is a line graph plotting the growth of a given dollar amount over a period of time. It compares the accumulative performance of one manager against and index or against other managers.
Historical Ranking - The Quartile Historical Ranking graph displays the percentile ranking of a product against its peer group universe in a line format over multiple time periods.
Hybrid Allocation - The Hybrid Allocation/fund of fund graph illustrates the allocation percentage for each member of the hybrid.
Market Capitalization Breakdown – This bar graph shows the breakdown of the market capitalization in percentages. The market capitalization breakdowns are: % Micro Capitalization (<$500 million), % Small Capitalization (>$500 million - <$2 Billion), % Medium Capitalization (2-7 $Billion) and % Large Capitalization (>7 $Billion).
Market Capture - The Upside vs. Downside Market Capture graph measures the market shares captured by a product for a selected date range; it further reveals the market trend of the selected product to show the capture ratio pattern of the product relative to a market index. Similar to the risk return graph, this graph is broken down into four quadrants relative to the upside to downside capture ratio instead of risk and return. The 100% capture ratio of the up market and the down market determines the intersection of the quadrants. The graph indicates the number of up quarters, return of the portfolio in an up market, return of the market index in an up market; percent of market capture in an up market, number of down quarters, return of the portfolio in a down market, return of the market index in a down market, and percent of market capture in a down market.
Market Risk Reward - The Market Risk Reward graph is used to compare the excess performance and market risk (beta) of selected managers against the excess performance and market risk of a market index for a specific period of time. The graph is broken down into 4 quadrants: Less Risk-Less Return, Less Risk-More Return, More Risk-More Return, and More Risk-Less Return. The risk index determines the intersection of the quadrants. In addition to the excess rate of return and beta, the analysis also calculates optional risk statistics such as tracking error, information ratio, alpha, and r-squared.
Monte Carlo - Probability of Growth– This graph is generated with saved hybrid. The graph will plot (in a line format) the growth of the Portfolio Value over Time and the probability in percentage of achieving the expected growth.
Monte Carlo - Range of Asset Values - This graph is generated with saved hybrid. The graph will plot (in a bar format) the growth of the Portfolio Value over Time.
Multi Scatter - The Multi Scatters graph is used to compare the performance and risk (standard deviation) of selected managers against the performance and risk of a market index for up to six selected date ranges.
Multiple Statistic Date Bar - The Multiple Statistic Date Bar graph enables users to select from one to eight statistics, up to eight date ranges, and a single product. The graph will plot all of these selections onto a single page. Products can be any manager, portfolio, and market index. Statistics and time periods can be user selected as well. This graph gives users a quick glance at how a manager performs against a select benchmark for each statistical category in multiple time periods.
Multiple Statistic Manager Bar - The Multiple Statistic Manager Bar graph enables users to select from one to eight statistics, up to eight products, and a single date range. The graph will plot all of these selections onto a single page. Products can be managers, portfolios, and market indexes. Statistics can be user selected as well. This graph gives users a quick glance at how each manager performs against each other for each statistical category in single time period.
Multi-Statistic Quartile Ranking Bar - The Multiple Statistics Quartile Ranking graph is used to rank various performance and statistics of PSN managers, market indexes or your own self-entered products against a universe. The range of returns/ other modern portfolio characteristics in the universe are represented by floating bars. Each bar is broken up into 4 quartiles. The upper quartile represents the top 25% of the managers in the particular universe for the particular time period (you can choose up to eight time periods). The managers, indexes and portfolios are plotted relative to the floating bars.
Percentile Report - The Percentile report shows the performance and percentile ranking for each manager in a selected universe. The user selects the statistic and the date ranges to generate the report. The report shows how consistent a manager’s percentile ranking is in comparison to other managers in the same universe over multiple time periods.
Performance Bar - The Performance Bar graph is a bar chart showing statistics on managers, portfolios and market indexes for up to Eight Time periods. This graph gives a quick performance comparison on different managers, portfolios and indexes.
Performance Historical ROR by Period - The Performance Historical ROR by Period report allows the user to run a performance report on a product for one selected time period. The report will show performance since inception by default. The report can either be on a quarterly or monthly basis.
Performance ROR vs. Benchmark – The Performance Bar vs. Benchmark report contains the growth of $1000 graph, risk reward total graph, performance and MPT statistic for a selected product. This report gives user a sense of risk and reward perspective on a product versus its benchmark and both graphical and tabular formats.
Performance Summary - The Performance Summary report is an efficient and productive way to generate a report in the system that contains various statistics about a product. Statistics include: Best worst quarters, best worst year, long consecutive winning and losing streak, performance and other MPT statistics versus a selected benchmark.
Performance vs. Benchmark – The Performance ROR vs Benchmark report is an efficient and productive way to generate a report in the system that contains various performance comparisons about a product and an associated benchmark. This single page report presents historical performance on both the product and the benchmark in an extreme concise format.
Performance vs. Compounded - The Historical ROR vs. Compound ROR Analysis graph shows in a bar format the rate of return for the product going back to since inception. The graph also displays in a line format the compounded (or annualized) ROR from the beginning date to any point in time for the product, i.e., each value on the line represents the annualized rate of return for the product from the beginning date to the date correspond to that value.
Performance vs. Compound Excess - The Historical ROR vs. Compound Excess ROR Analysis graph shows in a bar format the rate of return for the product going back to since inception. The graph also displays in a line format the compounded (or annualized) excess ROR from the beginning date to any point in time for the product, i.e., each value on the line represents the annualized rate of return for the product minus the annualized rate of return for the benchmark from the beginning date to the date correspond to that value.
Performance vs. Cumulative - The Historical ROR vs. Cumulative Total ROR Analysis shows in a bar format the rate of return for the product going back to since inception. The graph also displays in a line format the Cumulative Total ROR going back to since inception for the product, i.e., each value on the line represents the cumulative rate of return for the product from the beginning date to the date correspond to that value.
Performance vs. Cumulative Excess - The Historical ROR vs. Cumulative Excess ROR Analysis graph shows in a bar format the rate of return for the product going back to since inception. The graph also displays in a line format the Cumulative Excess ROR going back to since inception for the product, i.e., each value on the line represents the cumulative excess rate of return for the product minus the benchmark from the beginning date to the date correspond to that value.
Performance vs. Excess - The Historical ROR vs. Excess ROR Analysis graph shows in a bar format the rate of return for the product going back to since inception. The graph also displays in a line format the Cumulative Excess ROR going back to since inception for the product, i.e., each value on the line represents the excess rate of return for the product minus the benchmark for that monthly or quarterly period.
Performance vs. Growth - The Historical ROR vs. Dollar Analysis graph shows in a bar format the rate of return for the product going back to since inception. The graph also displays in a line format the growth of an investment going back to since inception for the product. The dollar amount can be changed.
Periodic Table - Often referred to as a Periodic Table report, this report lists the best and worst performers for a specified period of time. Manager or indices are displayed in multi-colored boxes and retain their specified color throughout for easy comparison. Usually displayed with rates of returns, this report will work with any statistic in PSN. The Periodic Table was originally found in our Allocation Optimizer, but was so popular that we decided to add it to our Multi-Manager section.
Product Data Profile- This is the primary PSN Product Data Profile containing every data fields collected by Informa Investment Solutions. There are six different types of product data profiles. They are: US Equity, US Fixed Income, US Balanced, Global/International Equity, Global/International Fixed Income, and Global/International Balanced.
Each profile includes information very specific to the asset class. Information includes:
Contact
Assets & Accounts
Product Personnel
Investment Styles
Market Capitalization
Maturity
Duration
Sector Distribution
Decision Making Process
Offering Information
Portfolio Characteristics/Policy
Fees and Minimums
Sponsor Programs
Asset Allocation
Compliance
Composite Construction
Performance & Footnote
Product Fee Summary - The Product Fee Summary report includes: account type, account size, annual fee, minimum account size, minimum annual fee, and growth of $10,000,000 graph line. The graph shows growth of a dollar results with or without fees. The results are calculated using reported fees or custom fees.
Product Narrative - This is the primary PSN Product Narrative written by the manager and containing the following:
Investment Philosophy
Decision Making Process
Portfolio Construction
Key Investment Officer
Fees and Minimums
Product – Top 50 Net Flows - This report will display the ranking of the top 50 products by Flow for the most recent quarter and provides the most complete view of each product by assets, as well as market share and return.
PSN – AUM by Client Segment - This report will display series of pie charts showing current assets invested in US Taxable, US Tax Exempt and Non-US investors for comparison purposes. Reviewing this page alongside of the previous quarters’ report shows the asset shifts on the investor level.
PSN – AUM Growth - This report will display simple graphics providing the first step to the universe breakdown by growth, which combines flow and performance.
Quartile Fee Ranking Bar - Plot product’s fee against any universe. Find out the dollar amount of what your product charges versus any group of products.
Quartile Historical Distribution - The Quartile Historical Distribution graph compares the performance of a product against its peer group universe for multiple date ranges. The graph displays the universe distribution (High, First Quartile, Median, Third Quartile and Low) in a line format and identifies where the product performs in relation to the universe quartiles for each period.
Quartile Historical Ranking - The Quartile Historical Ranking graph displays the percentile ranking of a product against its peer group universe in a line format over multiple time periods.
Quartile Ranking Bar - The Quartile Ranking graph is used to rank the performance of PSN managers, market indexes or your own self-entered products against a universe. The range of returns/ other modern portfolio characteristics in the universe are represented by floating bars. Each bar is broken up into 4 quartiles. The upper quartile represents the top 25% of the managers in the particular universe for the particular time period (you can choose up to eight time periods). The managers, indexes and portfolios are plotted relative to the floating bars.
Regional Allocation Bar - This bar graph shows the regional allocation percentage investment managers provide to PSN. The regions available are: US and Canada, North America, South America, Europe, Pacific Basin, Emerging, EAFE Mandates, Regions Cash, Latin America and Africa.
Risk Reward – Excess - The Excess Risk Reward graph is used to compare the excess performance and excess risk (tracking error) of selected managers against the excess performance and excess risk of a market index for a specific period of time. The graph is broken down into 4 quadrants: Less Risk-Less Return, Less Risk-More Return, More Risk-More Return, and More Risk-Less Return. The risk index determines the intersection of the quadrants. In addition to the excess rate of return and tracking error, the analysis also calculates optional risk statistics such as information ratio, alpha, and r-squared.
Rolling Excess Risk Reward - The Excess Risk Reward graph is used to compare the excess performance and excess risk (tracking error) of selected managers against the excess performance and excess risk of a market index for a number of time periods on a rolling basis. The smaller symbols indicate earlier time periods while larger symbols indicate most recent time periods. The largest symbol identifies the longest time period. . The graph is broken down into 4 quadrants: Less Risk-Less Return, Less Risk-More Return, More Risk-More Return, and More Risk-Less Return. The risk index determines the intersection of the quadrants. This graph give user a sense of excess return versus excess risk migration for each selected product. In addition to the excess rate of return and tracking error, the analysis also calculates optional risk statistics such as information ratio, alpha, and r-squared.
Rolling Market Risk Reward - The Market Risk Reward graph is used to compare the excess performance and market risk (beta) of selected managers against the excess performance and market risk of a market index for a number of time periods on a rolling basis. The graph is broken down into 4 quadrants: Less Risk-Less Return, Less Risk-More Return, More Risk-More Return, and More Risk-Less Return. The risk index determines the intersection of the quadrants. This graph gives users a sense of excess return versus market risk migration for each selected product. In addition to the excess rate of return and beta, the analysis also calculates optional risk statistics such as tracking error, information ratio, alpha, and r-squared.
Rolling Quartile Ranking Bar - View up to 80 rolling periods of quartiles on one graph by using the Rolling Quartile Ranking Bar in the Single Manager and Multi-Manager sections. This graph is extremely useful in spotting universe and manager trends over a long period of time.
Rolling Single-Statistic Mgr Line - The Rolling Single – Statistic Mgr line graph is a rolling date range graph for one selected statistic. The graph will show one selected date range. Within the date range it will show the number of months for each selected rolling cycle and the number of months in between each selected cycle. By default, the date range is 8 years with 36 months for each rolling cycle and 12 months in between each cycle. The return for the selected date range is annualized.
Rolling Total Risk Reward - The Rolling Risk Reward graph is used to compare the performance and risk (standard deviation) of selected managers against the performance and risk of a market index for a number of time periods on a rolling basis. The smaller symbols indicate earlier time periods while larger symbols indicate most recent time periods. The largest symbol identifies the longest time period. The graph is broken down into 4 quadrants: Less Risk-Less Return, Less Risk-More Return, More Risk-More Return, and More Risk-Less Return. The risk index determines the intersection of the quadrants. This graph gives users a sense of return versus risk migration for each selected product. In addition to the rate of return and standard deviation, the analysis also calculates optional risk statistics such as alpha, beta, and r-squared.
The graph is broken down into 4 quadrants: Less Risk-Less Return, Less Risk-More Return, More Risk-More Return, and More Risk-Less Return. The risk index determines the intersection of the quadrants.
Style Allocation History – The Style Allocation History graph reveals the historical styles allocation of a product in an area graph format. This gives user a view into the moment of each style allocation from period to period as assessed by William Sharpe’s return-based style framework. MIN, MAX, MEAN are allocation exposures while % IN and % OUT identify the percentage that the product has been in or out of each investment style for the entire time period.
Style Quadrants – The Style Quadrants graph is perhaps the most popular graph among all return-based style graphic. Depending on the asset class, the user can view the style movement allocated in a four “extreme” style quadrants. Certainly, the lesser the move, the better a manager adhere to a single style investment. This intrinsic assessment is based on the work of William Sharpe in his return-based styles framework and analysis.
Style Summary – The Style Summary graph is a graphical display of the results as depicted by William Sharpe’s return-based styles analysis. This is a report including the investment exposure to each investment styles, the variance (“how much is explained”) based on style investment (“return-based assessment using selected benchmarks”) and security selection (“unknown/error term”). In addition, cumulative and total returns are shown for both styles and selection exposures.
Total Risk Reward - The Risk Reward graph is used to compare the performance and risk (standard deviation) of selected managers against the performance and risk of a market index for a specific period of time. The graph is broken down into 4 quadrants: Less Risk-Less Return, Less Risk-More Return, More Risk-More Return, and More Risk-Less Return. The risk index determines the intersection of the quadrants. In addition to the rate of return and standard deviation, the analysis also calculates optional risk statistics such as alpha, beta, and r-squared.
Universe Risk Reward - Plot an entire universe’s risk/reward on an X/Y axis graph. Each manager is identified on the graph and in the legend.
Universe Fee - The Universe Fee Report shows the percentile distribution breakdown (High, First Quartile, Median, Third Quartile, Low, Mean and also the Valid Count) of fee information for up to eight published universes. The percentile distribution is available for $1 Million Account Size, $5 Million Account Size, $10 Million Account Size, $25 Million Account Size, $50 Million Account Size and $100 Million Account Size. Fees are in thousands (i.e. 50 = 50,000).
Universe – Net Flows - This report will display the estimated net flow for the 48 PSN Universes covered in the PSN SMA Flows. The flows are stated for the most recent quarter (MRQ), previous quarter (Prev Q) and for year to date (YTD). Assets for the products included are outlined as well as the return for the median manager.
Universe Percentile - The Universe Percentile report shows the performance and percentile ranking for each manager in a selected universe. The user selects the statistic and the date ranges to generate the report. The report shows how consistent a manager’s percentile ranking is in comparison to other managers in the same universe over multiple time periods.
Universe – Top 10 Assessment - This report will display the ranking of the top 10 products in a universe according to Assets, Flow, Growth and Performance. Over time, the report allows the PSN client to see the movement among top spots and what drives the movement. Note: The universe in the report will be the peer universe of the selected product the PSN client selects at the Selection screen in PSN.
Universe – Top 10 Bubble - This report will display the top 10 products in a universe. Asset size bubbles are plotted on a one year over a three year grid. The median results are plotted by the dashed line, in order to help gauge the success of the category, and to support competitor analysis. This provides fodder for shelf-space, asset at risk and new product opportunity evaluation. Note: The universe in the report will be the peer universe of the selected product the PSN client selects at the Selection screen in PSN.
Value Added - The Value Added Analysis graph compares the performance of the product against its benchmark for one time period. The graph is divided into two quadrants with the concept of x = y: Values above the diagonal line outperform the benchmark. Values below the diagonal line under-perform the benchmark. The graph displays the total number of quarters for the selected time period (5 year = 20 quarters).
Value at Risk - statistical technique used to measure and quantify the level of financial risk within a firm or investment portfolio over a specific time frame. Value at risk is used by risk managers in order to measure and control the level of risk which the firm undertakes. The risk manager's job is to ensure that risks are not taken beyond the level at which the firm can absorb the losses of a probable worst outcome. Historical Method - The historical method simply re-organizes actual historical returns, putting them in order from worst to best. It then assumes that history will repeat itself, from a risk perspective
XY Analysis - Plot any statistic on the X axis and Y axis of a risk/reward graph. Users can already plot Return/Standard Deviation, Excess Return/Beta through our current graph options.
This section contains all statistics available via PSN Enterprise. Based on your level of PSN Enterprise subscription, some of them may not be available to you. Please contact Informa Investment Solutions client services at clientservices@informais.comfor further details.
Alpha – (default in the system) Alpha measures nonsystematic return or the return that cannot be attributed to the market. Thus, it can be thought of as how the manager performed if the market has had no gain or loss. In contrast, beta measures the return that is attributable to the market and is a measure of the portfolio's overall volatility.
If the market's return as measured by an index was equal to the risk-free rate, the manager's expected excess return would be Alpha. A positive alpha implies that the manager has added value to the return of the portfolio over that of the market. Returns with negative Alpha do not reflect any positive expected contribution by the manager over the performance of the market. An Alpha of zero implies that a manager has provided a return that is equivalent to the market return for the manager's specific risk class.
Alpha is the annualized y-intercept of the best fit line based on ordinary least squares regression, using the market's quarterly (or monthly) return less the risk-free rate as the independent variable and the manager's quarterly (or monthly) return less the risk-free rate as the dependent variable.
The formula for alpha is:
A = Y - BX
Where:
Y is the average of the manager’s return minus the risk free rate
X is the average of the index’s return minus the risk free rate
B is the manager’s Beta
Ordinary Least Squares estimation will provide a statistical estimate of a monthly (or quarterly) Alpha. However, it is important to annualize this so it can be compared with other annualized figures. The process to annualize Alpha is:
![]()
Where:
![]() is the quarterly (or monthly) alpha
is the quarterly (or monthly) alpha
P is the number of periods per year (12 for monthly frequency or 4 for quarterly)
Asset Flow – Displays the estimated asset flow in US$ of the investment. Flow is the dollars gained or lost by the investment not attributable to returns for any period of time. Flow is calculated for
ex: if it is for 1year ,calculate the flow for separate quarters( 4 qtrs) and then sum up all the 4 flows together (cumulative), it gives the flow for 1 year.
The formula for Asset Flow is:
![]()
![]()
Where:
∑ is the summation operator
![]() represents
the assets ending value
represents
the assets ending value
![]() represents
the assets beginning value
represents
the assets beginning value
R represents the quarter rate of returns divided by 100.
Asset Growth – Displays the percentage change in Assets under Management for any time period.
The formula for Asset Growth rate is:
![]()
Where:
![]() represents
the assets ending value
represents
the assets ending value
![]() represents the assets beginning
value
represents the assets beginning
value
Average Compound Return – Average Compound Return displays the quarterly geometric return for a stream of data. It is similar to the Rate of Return statistic, but while Rate of Return shows annualized geometric means, Average Compound Return shows the quarterly (or monthly) geometric mean.
The formula for Average Compound Return is:
![]()
Where:
![]() is
the product operator
is
the product operator
r is the monthly (or quarterly) returns during the selected timeframe
n is the number of months (or quarters) in the selected timeframe
Average Drawdown - is the average drawdown % from an equity peak to an equity valley.
Average Deviation - Average Deviation is the average of the absolute value of the deviation of data points from their mean. Like Standard Deviation, it is a measure of volatility of a data set. However, unlike Standard Deviation, Average Deviation is not annualized.
The formula for Average Deviation is:
![]()
Where:
![]() is
the summation operator
is
the summation operator
![]() represents
the individual monthly (or quarterly) returns during the selected timeframe
represents
the individual monthly (or quarterly) returns during the selected timeframe
![]() represents
the average of the monthly (or quarterly) returns
represents
the average of the monthly (or quarterly) returns
n represents the number of months (or quarters) during the selected timeframe
Average Drawdown - Average Drawdown is defined as the average of all the drawdowns experienced over some timeframe. A drawdown is defined the percentage lost from a peak to a valley. Over time, products may experience several peaks and valleys. This statistic is designed to show the average loss during a downturn.
Average Drawdown Duration - the average # of drawdown periods from an equity peak to an equity valley. Where Average Drawdown seeks to provide some measure of average magnitude to periods of decrease Average Drawdown Duration attempts to provide some measure of the average duration over which a decrease is experienced.
Average Gain - This is an arithmetic average of returns for the periods with a gain. It is calculated by summing the returns for gain periods where rates of return are >= 0 and then dividing the total by the number of gain periods.
The formula for Average Gain is:
![]()
Where:
![]() is
the summation operator
is
the summation operator
![]() is
the monthly (or quarterly) returns during the selected timeframe that
were positive
is
the monthly (or quarterly) returns during the selected timeframe that
were positive
![]() is
the number of monthly (or quarterly) returns during the selected timeframe
that were positive
is
the number of monthly (or quarterly) returns during the selected timeframe
that were positive
Average Loss (Loss Mean) - This is an arithmetic average of returns for the periods with a loss. It is calculated by summing the returns for loss periods where rates of return < 0 and then dividing the total by the number of loss periods.
The formula for Average Loss is:
![]()
Where:
![]() is
the summation operator
is
the summation operator
![]() is
the monthly (or quarterly) returns during the selected timeframe that
were negative
is
the monthly (or quarterly) returns during the selected timeframe that
were negative
![]() is
the number of monthly (or quarterly) returns during the selected timeframe
that were negative
is
the number of monthly (or quarterly) returns during the selected timeframe
that were negative
Average Rate of Return - While this is similar in scope to Rate of Return or Average Compound Return, it is calculated somewhat differently because it is a simple period (month or quarter) average of the returns. It is not annualized.
The formula for Average Rate of Return is:
![]()
Where:
![]() is
the summation operator
is
the summation operator
![]() is
the monthly (or quarterly) returns during the selected timeframe
is
the monthly (or quarterly) returns during the selected timeframe
![]() is
the number of monthly (or quarterly) returns during the selected timeframe
is
the number of monthly (or quarterly) returns during the selected timeframe
Average Recovery - is the average recovery % from an equity valley to an equity peak. Over time, products may experience several peaks and valleys. This statistic is designed to show the average gain during a recovery.
Average Recovery Duration - the average # of recovery periods from an equity valley to an equity peak. Where Average Recovery seeks to provide some measure of average magnitude to periods of increase Average Recovery Duration attempts to provide some measure of the average duration over which an increase is experienced.
Batting Average – (default in the system) is defined as the number of periods that the product outperforms the benchmark divided by the total number of periods for the entire period. It is a percentage indicating the probability of outperforming the index in a given date range.
Benchmark # of Negative Periods - is the number of periods that the benchmark was less than zero during the timeframe being measured.
Benchmark # of Positive Periods - is the number of periods that the benchmark was greater than zero during the timeframe being measured.
Best case Return – The best possible return which could have been calculated during a given time interval. It is expressed as a percentage value. If an investor could invest fully at a valley and withdraw fully at the highest following peak, he or she could realize the maximum return over the given timeframe.
The formula for Best case Return is:
Best
Case Return![]()
Where:
![]() is
the cumulative return at time T
is
the cumulative return at time T
![]() is
the cumulative return at time t
is
the cumulative return at time t
Best Four Quarters Return - Within a selected date range (For example: 5 years trailing), the manager’s best rate of return for every consecutive rolling four quarters. The four consecutive quarters do not necessarily correspond with calendar years.
Best Quarter – is defined as the highest single quarterly return reported by a manager during the specified time period. While a single quarter is a very brief period to evaluate, this measure of extremes may be used to gauge risk, especially against similar managers or the market.
Best Year - is the best calendar year performance for the product in the period being measured.
Beta – (default in the system) A measurement indicating the volatility of a manager relative to a chosen market. A beta of 1 means a manager has about the same volatility as the market. Higher betas are associated with higher risk levels, while lower beats are associated with lower risk levels.
Beta is estimated by the slope of the best fit line based of the ordinary least squares regression using the market's quarterly (or monthly) return less the risk-free rate as the independent variable and the manager's quarterly (or monthly) return less the risk-free rate as the dependent variable. For an individual asset, the statistical formula for calculating beta is the covariance of the manager (less the risk free rate) and the index (less the risk free rate) divided by the variance of the index (less the risk free rate).
The formula for Beta is:
![]()
Where:
![]() is
the covariance between the manager (less the risk free rate) and the index
(less the risk free rate)
is
the covariance between the manager (less the risk free rate) and the index
(less the risk free rate)
![]() is
the variance of the index (less the risk free rate)
is
the variance of the index (less the risk free rate)
Beta-Adjusted Information Ratio - is very similar to the standard Information Ratio. They are both measures of risk-adjusted performance. The main difference is that risk and excess return measures for this statistic include an adjustment (via Beta) for the benchmark index.
The formula for Beta-Adjusted Information Ratio is:
Where:
![]() is
the excess return above the risk free rate for the manager
is
the excess return above the risk free rate for the manager
![]() is
the excess return above the risk free rate for the benchmark index
is
the excess return above the risk free rate for the benchmark index
![]() is
the manager’s beta
is
the manager’s beta
![]() is
the variance of the manager
is
the variance of the manager
![]() is
the variance of the benchmark index
is
the variance of the benchmark index
Beta-Adjusted Standard Deviation – is similar to the regular version of Standard Deviation – it is a measure of dispersion or total risk. The difference with this statistic is that it includes a risk adjustment factor (Beta) that helps to account for the overall risk of the market.
The formula for Beta-Adjusted Standard Deviation is:
![]()
Where:
![]() is
the manager’s beta
is
the manager’s beta
![]() is
the variance of the manager
is
the variance of the manager
![]() is
the variance of the benchmark index
is
the variance of the benchmark index
Calmar Ratio - is a risk/return ratio that shows the annualized rate of return relative to the absolute value of the maximum drawdown, the higher the Calmar ratio, the better. Some funds have high annual returns, but they also have extremely high drawdown risk. Most people use data from the past 3 years in assessing results of this ratio
.
The formula for Calmar Ratio is:
Calmar Ratio = (Annualized Rate of Return) / (abs [Maximum Drawdown])
Correlation Coefficient – (default in the system) Correlation measures the strength and direction of linear association between two variables. This coefficient allows the user to determine which combination of managers/products will best complement each other. The range of values is from -1 to 1. A value of negative 1 indicates a perfectly negative linear relationship, whereas a value of positive 1 indicates a perfectly positive linear relationship. A value of 0 indicates no linear relationship at all.
The formula for Correlation Coefficient is:
![]()
Where:
![]() is
the covariance between the two items being measured
is
the covariance between the two items being measured
![]() is
the standard deviation of the first item being measured
is
the standard deviation of the first item being measured
![]() is
the standard deviation of the second item being measured
is
the standard deviation of the second item being measured
Cumulative Growth – is defined as the total return percentage of a product over a given time. Please note that this is a total return measurement and is not an annualized return.
The formula for Cumulative Growth is:
![]()
![]()
Where:
![]() is
the product operator
is
the product operator
![]() represents
the individual monthly (or quarterly) returns
represents
the individual monthly (or quarterly) returns
n is the total number of months (or quarters) during the selected timeframe
Cumulative Excess Rate of Return – is defined as cumulative return of the manager minus the cumulative return of an index over a given timeframe. Please note that this is not an annualized return.
The formula for Cumulative Excess Return is:
Mc – Ic
Where:
Mc is the cumulative return of the manager over the selected timeframe
Ic is the cumulative return of the index over the selected timeframe
Cumulative Annualized Excess Return – (default in the system) is defined to be the difference between the annualized return of the manager and the annualized return of the benchmark index over the selected timeframe.
Note: This statistic finds the annualized returns of both the manager and the index first and then subtracts, whereas the Excess Return statistic finds the differences of the manager and benchmark first and then annualized those differences. The results are generally very similar, but can be different.
The formula for Cumulative Annualized Excess Return is:
![]()
Where:
![]() is
the annualized return of the manager over the selected timeframe
is
the annualized return of the manager over the selected timeframe
![]() is
the annualized return of the benchmark index over the selected timeframe
is
the annualized return of the benchmark index over the selected timeframe
Cumulative Downside Market Index Capture Return - is very similar to the Cumulative Downside Capture Return. The main difference is that this statistic measures the Cumulative returns of the index in a down market. A down market is defined as any period (month or quarter) where the index is in negative territory.
Cumulative Downside Capture Return- the cumulative returns of the manager during a down market. A down market is defined as any period (month or quarter) where the market’s (index’s) cumulative return is less than zero.
The Cumulative Downside Capture Return is the numerator in the Cumulative Downside Market Capture Ratio.
Cumulative Downside Market Capture Ratio - measures the manager’s performance in down markets relative to the performance of the market (index) itself. A Cumulative down market is defined as any period (month or quarter) where the market’s return is less than zero.
The lower the Cumulative Downside Market Capture Ratio, the better the manager protected capital during a market decline. A value of 90 suggests that a manager’s losses were only 90% of the market’s loss when the market was down.
Note: the magnitude of the ratio may be deceiving if the nominal numbers are small. For example, a Cumulative Downside Market Capture Ratio of 300 indicates that the manager lost 300% of the index’s loss during a down market. However, if the manager’s cumulative return was -.3% and the market’s cumulative return was -.1% the ratio is 300, but the actual difference is trivial.
The formula for Cumulative Downside Market Capture Ratio is:
![]()
Where:
DMCR is the Cumulative Downside Market Capture Ratio
![]() is the cumulative return of
the manager in a down market
is the cumulative return of
the manager in a down market
![]() is the cumulative
return of the index in a down market
is the cumulative
return of the index in a down market
Cumulative Upside Market Capture Return - The Cumulative Up Market Capture Return is the cumulative return of the manager during an up market. An up market is defined as any period (month or quarter) where the market’s (index’s) return is greater than or equal to zero.
The Cumulative Up Market Capture Return is the numerator in the Cumulative Up Market Capture Ratio
Cumulative Upside Market Capture Ratio –the Cumulative Upside Market Capture Ratio measures the manager’s performance in up markets relative to the performance of the market (index) itself. An up market is defined as any period (month or quarter) where the market’s return is greater than or equal to zero.
The higher the Cumulative Upside Market Capture Ratio, the better the manager grew capital during a market expansion. A value of 110 suggests that a manager’s gain was 110% of the market’s gain when the market was up.
Note: the magnitude of the ratio may be deceiving if the nominal numbers are small. For example, a Cumulative Upside Market Capture Ratio of 300 indicates that the manager gained 300% of the index’s increase during a down market. However, if the manager’s cumulative return was 0.3% and the market’s cumulative return was 0.1% the ratio is 300, but the actual difference is trivial.
The formula for Cumulative Upside Market Capture Ratio is:
![]()
Where:
UMCR is the Cumulative Upside Market Capture Ratio
![]() is
the cumulative return of the manager in an up market
is
the cumulative return of the manager in an up market
![]() is
the cumulative return of the index in an up market
is
the cumulative return of the index in an up market
Cumulative Upside Market Index Capture Return- The Cumulative Upside Market Index Capture Return is very similar to the Cumulative Upside Market Capture Return. The main difference is that this statistic measures the cumulative return of the index in an up market. An up market is defined as any period (month or quarter) where the index is in positive territory.
Dollar Investment – is defined as the amount of money that would be available at the end of a given timeframe assuming some initial investment at the beginning of that timeframe with no contributions or withdrawals along the way. Essentially, it is the initial investment (which is set by the user) multiplied by Cumulative Growth.
The formula for Dollar Investment is:
(Cumulative Growth) * (Initial Dollar Investment)
Downside Market Capture Ratio – (default in the system) measures the manager’s performance in down markets relative to the performance of the market (index) itself. A down market is defined as any period (month or quarter) where the market’s return is less than zero.
The lower the Down Market Capture Ratio, the better the manager protected capital during a market decline. A value of 90 suggests that a manager’s losses were only 90% of the market’s loss when the market was down.
Note: the magnitude of the ratio may be deceiving if the nominal numbers are small. For example, a Down Market Capture Ratio of 300 indicates that the manager lost 300% of the index’s loss during a down market. However, if the manager’s return was -.3% and the market’s return was -.1% the ratio is 300, but the actual difference is trivial.
The formula for Downside Market Capture Ratio is:
![]()
Where:
DMCR is the Down Market Capture Ratio
![]() is
the return of the manager in a down market
is
the return of the manager in a down market
![]() is
the return of the index in a down market
is
the return of the index in a down market
Downside Capture Return – (default in the system) the return of the manager during a down market. A down market is defined as any period (month or quarter) where the market’s (index’s) return is less than zero.
The Down Market Capture Return is the numerator in the Downside Market Capture Ratio.
Downside Probability - The probability that a manager will not achieve a target return. The target return may also be called the minimum acceptable return (MAR). A high Downside Probability suggests that the manager frequently misses the target.
The formula for Downside Probability is:
![]()
Downside Risk - (also referred to as Downside Deviation) is an alternate measure of risk to Standard Deviation. While Standard Deviation measures the variation of returns around the mean, Downside Risk measures the variation of returns below the target return (also called the minimum acceptable return, or MAR). The target return could be a static value or it could represent the return of an index.
The concept of Downside Risk assumes that each investor has some target return in mind, and that this investor is only concerned with deviations below that target. In this way, risk is broken into two pieces - Downside Risk (which is viewed negatively) and Upside Uncertainty (which is viewed positively).
It is important to note that only returns less than the target are considered for this calculation.
The formula for Downside Risk is:
 x
x
![]()
Where:
DR is Downside Risk
T is the target return (or MAR)
n is the total number of observation during the specified timeframe
![]() represents
the returns of the manager that are below the target
represents
the returns of the manager that are below the target
f is the frequency. For monthly data it is 12 and for quarterly data it is 4. This annualizes the statistic.
Downside Market Index Capture Return – is very similar to the Down Market Capture Return. The main difference is that this statistic measures the annualized return of the index in a down market. A down market is defined as any period (month or quarter) where the index is in negative territory.
Drawdown - is any losing period for an investment. It is defined as the percent retrenchment from an equity peak to an equity valley. A Drawdown is in effect from the time an equity retrenchment begins until a new equity high is reached. (i.e. In terms of time, a drawdown encompasses the period from equity peak to equity valley
Excess Rate of Return – (default in the system) is calculated by subtracting the return of the benchmark index from the return of the manager for every period (month or quarter) over the selected timeframe.
Note: This statistic finds the differences of the manager and benchmark first and then annualizes those differences, whereas the Cumulative Annualized Excess Return statistic finds the annualized returns of both the manager and the index first and then subtracts. The results are generally very similar, but can be different.
The formula for Excess Return is:

Where:
![]() is
the product operator
is
the product operator
![]() represents
the monthly (or quarterly) returns of the manager over the selected timeframe
represents
the monthly (or quarterly) returns of the manager over the selected timeframe
![]() represents
the monthly (or quarterly) returns of the index over the selected timeframe
represents
the monthly (or quarterly) returns of the index over the selected timeframe
y is the number of years during the selected timeframe
Floating Bars - Each quartile ranking graph contains floating bars that represent manager's performance, based on a statistic, for a selected time period. For each floating bar there is a high, low, median, mean, and first and third quartile cut off points, all representing a chosen statistic. The high number, or highest line in the floating bar, indicates the top performing manager within your universe of managers. The low number, or lowest line in the floating bar, represents the lowest performer in your universe. The median provides you with a number that is in the middle of the high and low. The mean tells you what the average of that statistic was for the chosen universe in each time period. All of the above information is presented in tabular form, as well as graphically, below the graph and is broken down into your chosen time periods.
Geometric Mean - The measure is the same as Average Compound Return in this system. The geometric mean is a measure of central tendency calculated by multiplying a series of numbers and taking the nth root of the product, where n is the number of items in the series. The geometric mean is often used when finding an average for numbers presented as percentages.
For example, suppose you have an investment which earns 10% the first year, 50% the second year, and 30% the third year. What is its average rate of return? It is not the arithmetic mean, because what these numbers mean is that on the first year your investment was multiplied (not added to) by 1.10, on the second year it was multiplied by 1.60, and the third year it was multiplied by 1.20. The relevant quantity is the geometric mean of these three numbers.
The question about finding the average rate of return can be rephrased as: "by what constant factor would your investment need to be multiplied by each year in order to achieve the same effect as multiplying by 1.10 one year, 1.60 the next, and 1.20 the third?"
The answer is the geometric mean (1.10 x 1.60 x1.20) 1/3. If you calculate this geometric mean you get approximately 1.283, so the average rate of return is about 28% (not 30% which is what the arithmetic mean of 10%, 60%, and 20% would give you). Any time you have a number of factors contributing to a product, and you want to find the "average" factor, the answer is the geometric mean.
The formula for Geometric Mean is:
![]()
Where:
y1, y2, y3… are the arguments
n is the number of arguments
Information Ratio – Population-(default in the system) the Information Ratio-Population measures the active return of the manager divided by the manager’s active risk. Active return is the annualized differences of the manager and the benchmark index, while active risk is measured by tracking error.
Information Ratio-Population is similar to the Sharpe, Sortino, and Treynor Ratios in that it provides a measure of risk-adjusted return. They are all in the form of excess return divided by risk. Their differences revolve around the varying concepts of excess return and types of risk.
The formula for Information Ratio-Population is:
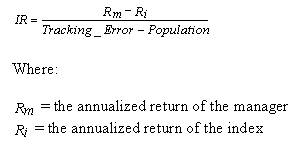
Information Ratio – Sample – measures the active return of the manager divided by the manager’s active risk. Active return is the annualized differenced of the manager and the benchmark index, while active risk is measured by tracking error – sample.
Information Ratio – Sample is virtually identical to the regular Information Ratio. The main difference is that the denominator (Tracking Error) uses the Sample (n-1) instead of the Population (n) number of observations. The result of this is a slightly more conservative (higher) reading for tracking error, which results in a lower overall Information Ratio.
The formula for Information Ratio – Sample is:
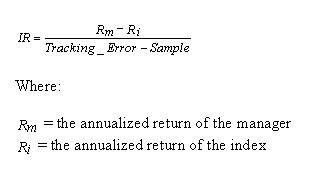
Kurtosis - is a measure of “peakedness” of a probability distribution. Higher kurtosis values indicate that more of the variance comes from infrequent extreme deviations. Lower kurtosis values indicate that the smaller and more frequent deviations are responsible for more of the variance.
Maximum Drawdown Percentage - is the maximum drawdown % over some time frame. A drawdown is defined as the percentage lost from a peak to a valley. Over time, products may experience several peaks and valleys. This statistic is designed to show the maximum loss during a single downturn.
Maximum Recovery Percentage - is the maximum recovery % over some time frame. A recovery is defined as the percentage gain from a valley to a peak. Over time, products may experience several peaks and valleys. This statistic is designed to show the maximum gain during a single recovery.
Maximum Return - Highest return achieved in any specified time period (monthly or quarterly).
Median - Median is described as the value separating the top half of a series of numbers from the bottom half. To calculate the median, first sort the returns from a given timeframe in descending order. Second, simply select the number at the midpoint of the sorted data.
Medians are often used in place of means (averages) because they are less sensitive to extreme outliers.
Median Absolute Deviation - Median Absolute Deviation (MAD) is a measure of the variability of a set of data (similar to Standard Deviation). It uses the medians of the deviations from the data’s median and the MAD is the median of their absolute values.
Unlike Standard Deviation, MAD is not an annualized value. It is based on the monthly (or quarterly) returns.
The formula for Median Absolute Deviation is:
![]()
Where:
![]() is
the median return of the manager over the given timeframe
is
the median return of the manager over the given timeframe
![]() is
the difference of each monthly (or quarterly) return from
is
the difference of each monthly (or quarterly) return from ![]()
![]() is
the absolute value operator
is
the absolute value operator
Median Correlation Coefficient- As with the regular correlation coefficient, the median correlation coefficient measures the strength and direction of linear association between two variables. The principle difference is that the median correlation coefficient uses medians (instead of means) for the calculation of covariance and standard deviation. In most cases, the median correlation coefficient and the standard version of the correlation coefficient should be relatively close. Differences will most likely be noticed only in situations where there are extreme outliers in the data.
Minimum Drawdown Percentage - is the minimum drawdown % experienced over some timeframe. A drawdown is defined as the percentage lost from a peak to a valley. / Over time, products may experience several peaks and valleys. This statistic is designed to show the minimum loss during a single downturn.
Minimum Recovery Percentage - is the minimum recovery % experienced over some timeframe. A recovery is defined as the percentage gain from a valley to a peak. Over time, products may experience several peaks and valleys. This statistic is designed to show the minimum gain during a single recovery.
Minimum Return – Smallest return achieved in any specified time period (monthly or quarterly).
Number of Benchmark Down Quarters - The number of quarters that the benchmark was less than zero in the period being measured.
Number of Drawdowns - displays the number of times the index value has been below a peak value. A drawdown always starts at the last highest peak (i.e., if the index has been at the same peak value twice in a row, a drawdown will start at the second peak value).
Number of Recoveries - displays the number of times the index value has been above a peak value. A recovery always starts at the last highest peak (i.e., if the index has been at the same peak value twice in a row, a recovery will start at the second peak value).
Number Benchmark of Up Quarters - The number of quarters that the benchmark was greater than zero in the period being measured.
Pain Index - Simply put, the pain index is a risk metric. However, one can define risk in many different ways. The pain index deals specifically with the last topic: the risk of losses or the capital preservation of a manager or benchmark index. The pain index quantifies three measures simultaneously: 1) the depth, 2) the duration, and 3) the frequency of losses.
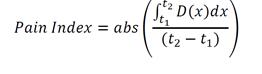
Pain Ratio - Typically in finance, once a risk metric is established, it is used in conjunction with a return metric to form a single ratio that compares return versus risk in a single trade-off metric. Extending the analogy of the pain index to standard deviation, the pain ratio is analogous to the Sharpe ratio. The laymen’s definition of the Sharpe ratio is the amount of return per unit of risk, and in Sharpe’s definition risk is defined as volatility. The pain ratio can be thought of as the amount of return per unit of “pain,” where pain is defined as losses in the investment
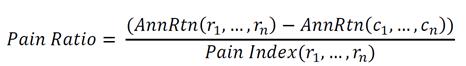
For a more detailed description, please see our white paper regarding Pain Index and Pain Ratio.
Product Negative Periods – is the number of periods (months or quarters) that the product was less than zero in the period being measured.
Product of Positive Periods - is the number of periods (months or quarters) that the product was greater than (or equal to) zero in the period being measured.
Quartiles - There are four quartiles within each floating bar, and each is broken into a 25% tier, for a total of 100%. The upper or first quartile indicates the top 25% of the managers in your universe with the second quartile representing the next 25%, and so on.
Quartile Ranking Legend – Based on a subset of managers, PSN allows users to choose up to eight managers/products/market indices to be plotted on the graph relative to the floating bars, which represent your current subset. The managers that you choose are displayed as a legend below the table, which indicates the high, low, etc. This legend provides the manager abbreviation and their exact performance for each time period and statistic selected. In addition to providing the exact statistic, PSN ranks each selected manager relative to your whole universe. For example, if ABC Co. had an 11.45% rate of return for 6/86-6/91, which placed eighth among 35 managers in your chosen universe, the ranking for ABC Co. is derived as follows:
The placement within the chosen universe is divided by the total number of managers in the chosen universe: 8/35 = 0.229. The number found in step one is then converted to a percentage: 0.229 * 100 = 22.9%. This number is then rounded as an integer which ranks ABC Co. as 22nd among a hypothetical 100 managers.
R-Squared – (default in the system) R-Squared (sometimes referred to as the coefficient of determination) measures the reliability of the statistical estimates of alpha and beta as a linear function of the market. A product with a high R-Squared can generally have most of its variance explained by the variations in the benchmark index. As a consequence, the estimates of alpha and beta can be used with confidence.
The formula for R-Squared is:

Where:
![]() represents
the individual observed values of the manager minus the risk free rate
represents
the individual observed values of the manager minus the risk free rate
![]() represents
the average of the observed values of the manager minus the risk free
rate
represents
the average of the observed values of the manager minus the risk free
rate
![]() represents
the predicted value of each observation given from the standard linear
regression model
represents
the predicted value of each observation given from the standard linear
regression model
Rate of Return – (default in the system) Rate of Return is the percentage gained or lost over a stated amount of time. PSN uses the monthly (or quarterly) returns from composites supplied directly by the managers. These returns are linked together for longer periods of time. Time periods in excess of one year are annualized.
Note: this formula shows how to annualize monthly (or quarterly) returns for time periods greater than one year.
The formula for Rate of Return is:

Where:
![]() is
the product operator
is
the product operator
![]() represents
the individual monthly (or quarterly) returns
represents
the individual monthly (or quarterly) returns
y is the number of years in the selected timeframe
Recovery - is any winning period during an investment record. It is defined as the percent success from an equity valley to a new equity peak.
Relative Risk - Relative Risk is defined as the standard deviation of the product divided by the standard deviation of the market (or benchmark index). Values greater than 1 indicate that the product experiences greater volatility than the index, while values less than one indicate that the product experiences less volatility than the index.
The formula for Relative Risk is:
![]()
Where:
![]() is
the standard deviation of the product
is
the standard deviation of the product
![]() is
the standard deviation of the index
is
the standard deviation of the index
Serial Correlation - Serial Correlation (sometimes referred to as autocorrelation) is the correlation of a variable with itself over certain periods of time. It gives the correlation coefficient between the return for a portfolio and the previous period’s return. It measures the predictability of a series’ or portfolio's return given knowledge of the previous period's return.
The formula for Serial Correlation is:
![]()
Where:
![]() is
the monthly (or quarterly) covariance of the current returns and the returns
lagged one period
is
the monthly (or quarterly) covariance of the current returns and the returns
lagged one period
![]() is
the monthly (or quarterly) standard deviation of the current returns
is
the monthly (or quarterly) standard deviation of the current returns
![]() is
the monthly (or quarterly) standard deviation of the returns lagged one
period
is
the monthly (or quarterly) standard deviation of the returns lagged one
period
Sharpe Ratio - Population – (default in the system) The Sharpe Ratio - Population is a measure of risk-adjusted return. It divides excess return by risk. Excess return is defined as the annualized return of the manager minus the annualized return of the risk free rate. Risk is defined by standard deviation. A high value for the Sharpe Ratio is generally considered to be positive since either the excess return is rather large or the level of risk is low.
The formula for Sharpe Ratio – Population is:
![]()
Where:
![]() is
the annualized return of the manager
is
the annualized return of the manager
![]() is
the annualized return of the risk free rate
is
the annualized return of the risk free rate
![]() is
the standard deviation of the manager
is
the standard deviation of the manager
Sharpe Ratio - Internal - The Sharpe Ratio – Internal is very much like the Sharpe Ratio – Population statistic discussed above. It is a measure of risk adjusted return. The major difference is that the denominator of the statistic is not the standard deviation of the manager, but instead is the sample standard deviation of the excess returns (tracking error – sample). This captures the risk associated with the excess returns instead of the risk solely associated with the manager.
The formula for Sharpe Ratio – Internal is:
![]()
Where:
![]() is
the annualized return of the manager
is
the annualized return of the manager
![]() is
the annualized return of the risk free rate
is
the annualized return of the risk free rate
![]() is
the standard deviation of the excess returns
is
the standard deviation of the excess returns
Sharpe Ratio - Sample - The Sharpe Ratio – Sample is very much like the Sharpe Ratio – Population statistic discussed above. It is a measure of risk adjusted return. The major difference is that the denominator of the statistic is not the population (n) standard deviation of the manager, but instead is the sample (n-1) standard deviation of the manager. This results in a slightly more conservative (higher) value for the standard deviation and tends to marginally reduce the value of the Sharpe Ratio.
The formula for Sharpe Ratio – Sample is:
![]()
Where:
![]() is
the annualized return of the manager
is
the annualized return of the manager
![]() is
the annualized return of the risk free rate
is
the annualized return of the risk free rate
![]() is
the sample standard deviation of the manager
is
the sample standard deviation of the manager
Skewness - Skewness measures the asymmetry of a probability distribution. A negative value indicates that the left tail of the distribution is longer, where a positive value indicates that the right tail is longer. The skewness of a standard normal distribution is zero.
The formula for Skewness is:
![]()
Where:
![]() is
the mean of the data X
is
the mean of the data X
![]() is
the standard deviation the data X
is
the standard deviation the data X
X is the data
Sortino Ratio - The Sortino Ratio is a measure of risk-adjusted return (similar to Sharpe Ratio). It divides excess return by risk. Excess return is defined as the annualized return of the manager minus the annualized return of the target (also referred to as the Minimum Acceptable Return or MAR). Risk is defined by Downside Risk. A high value for the Sortino Ratio is generally considered to be positive since either the excess return is rather large or the level of risk is low.
The formula for Sortino Ratio is:
![]()
Where:
![]() is
the annualized return of the manager
is
the annualized return of the manager
![]() is
the annualized return of the target (either a static value or an index)
is
the annualized return of the target (either a static value or an index)
![]() is
the downside risk of the manager
is
the downside risk of the manager
Standard Deviation - Population – (default in the system) Standard Deviation measures the central tendency of a probability distribution. The more a product varies from its mean, the higher the standard deviation.
Standard Deviation – Population is very similar to Standard Deviation – Sample. The main difference is that the population version uses “n” in the denominator where the sample version uses “n-1”. The sample version is considered to be a bit more conservative since it results in a slightly higher value of the statistic.
PSN annualizes standard deviation.
The formula for Standard Deviation – Population is:

Where:
![]() is
the summation operator
is
the summation operator
![]() represents
the individual monthly (or quarterly) returns of the product
represents
the individual monthly (or quarterly) returns of the product
![]() represents
the average (mean) of the monthly (or quarterly) returns of the product
represents
the average (mean) of the monthly (or quarterly) returns of the product
![]() is
the number of monthly (or quarterly) returns of the product
is
the number of monthly (or quarterly) returns of the product
![]() is
the frequency. For monthly data it would be 12 and for quarterly
data it would be 4
is
the frequency. For monthly data it would be 12 and for quarterly
data it would be 4
Standard Deviation – Sample - Standard Deviation measures the central tendency of a probability distribution. The more a product varies from its mean, the higher the standard deviation.
Standard Deviation – Sample is very similar to Standard Deviation – Population. The main difference is that the population version uses “n” in the denominator where the sample version uses “n-1”. The sample version is considered to be a bit more conservative since it results in a slightly higher value of the statistic.
PSN annualizes standard deviation.
The formula for Standard Deviation – Sample is:

Where:
![]() is
the summation operator
is
the summation operator
![]() represents
the individual monthly (or quarterly) returns of the product
represents
the individual monthly (or quarterly) returns of the product
![]() represents
the average (mean) of the monthly (or quarterly) returns of the product
represents
the average (mean) of the monthly (or quarterly) returns of the product
![]() is
the number of monthly (or quarterly) returns of the product
is
the number of monthly (or quarterly) returns of the product
![]() is
the frequency. For monthly data it would be 12 and for quarterly
data it would be 4
is
the frequency. For monthly data it would be 12 and for quarterly
data it would be 4
Sterling Ratio - The Sterling Ratio is another version of a risk-adjusted return. The return of the manager is divided by the average of the maximum yearly drawdowns.
The formula for Sterling Ratio is:
![]()
Where:
![]() is
the annualized rate of return of the manager
is
the annualized rate of return of the manager
Average Maximum Annual Drawdown is the average of the Maximum Drawdowns experienced over successive one-year periods.
T Statistic - The T-Statistic is used to measure a hypothesis test. In the case of PSN, it is used to see if the mean return is different from 0.
Note that this statistic will use monthly (or quarterly) data for the returns and the associated measures of dispersion.
The formula for T Statistic is:
![]()
Where:
![]() is
the arithmetic average of the series of returns
is
the arithmetic average of the series of returns
![]() is
the monthly (or quarterly) standard deviation of the series of returns
is
the monthly (or quarterly) standard deviation of the series of returns
![]() is
the number of returns in the series
is
the number of returns in the series
Total Drawdown - is the total % lost from all drawdown’s experienced during the selected timeframe.
Total Recovery - is the total % gained from all of the recoveries experienced during the selected timeframe.
Tracking Error – Population-(default in the system) Tracking Error- Population measures how closely a product tracks a benchmark index. It is the annualized standard deviation of the differences between a product’s monthly (or quarterly) returns and the benchmark index’s monthly (or quarterly) return. If a product tracks the index well, the tracking error will be low. If the product tracks the index exactly, the tracking error will be zero.
Tracking Error – Sample is very similar to Tracking Error- Population. The main difference is that Tracking Error-Population uses “n” in the denominator whereas Tracking Error – Sample uses “n-1”. The sample version is generally considered to be a bit more conservative as it results in a slightly higher value for tracking error.
The formula for Tracking Error- Population is:

Where:
![]() is
the summation operator
is
the summation operator
![]() represents
the individual monthly (or quarterly) differences between a product and
index
represents
the individual monthly (or quarterly) differences between a product and
index
![]() represents
the average (mean) of the monthly (or quarterly) difference between a
product and index
represents
the average (mean) of the monthly (or quarterly) difference between a
product and index
![]() is
the number of monthly (or quarterly) differences between a product and
index
is
the number of monthly (or quarterly) differences between a product and
index
![]() is
the frequency. For monthly data it would be 12 and for quarterly
data it would be 4
is
the frequency. For monthly data it would be 12 and for quarterly
data it would be 4
Tracking Error – Sample - Tracking Error measures how closely a product tracks a benchmark index. It is the annualize standard deviation of the differences between a product’s monthly (or quarterly) returns and the benchmark index’s monthly (or quarterly) return. If a product tracks the index well, the tracking error will be low. If the product tracks the index exactly, the tracking error will be zero.
Tracking Error – Sample is very similar to Tracking Error Population. The main difference is that Tracking Error Population uses “n” in the denominator whereas Tracking Error – Sample uses “n-1”. The sample version is generally considered to be a bit more conservative as it results in a slightly higher value for tracking error.
The formula for Tracking Error – Sample is:

Where:
![]() is
the summation operator
is
the summation operator
![]() represents
the individual monthly (or quarterly) differences between a product and
index
represents
the individual monthly (or quarterly) differences between a product and
index
![]() represents
the average (mean) of the monthly (or quarterly) difference between a
product and index
represents
the average (mean) of the monthly (or quarterly) difference between a
product and index
![]() is
the number of monthly (or quarterly) differences between a product and
index
is
the number of monthly (or quarterly) differences between a product and
index
![]() is
the frequency. For monthly data it would be 12 and for quarterly
data it would be 4
is
the frequency. For monthly data it would be 12 and for quarterly
data it would be 4
Treynor Ratio - The Treynor Ratio is a measure of risk-adjusted return (similar to Sharpe Ratio). It divides excess return by risk. Excess return is defined as the annualized return of the manager minus the annualized return of the risk free rate. Risk is defined by beta. A high value for the Treynor Ratio is generally considered to be positive since either the excess return is rather large or the level of risk is low.
The formula for Treynor Ratio is:
![]()
Where:
![]() is
the annualized return of the manager
is
the annualized return of the manager
![]() is
the annualized return of the risk free rate
is
the annualized return of the risk free rate
![]() is
the beta of the manager
is
the beta of the manager
Treynor Ratio – Internal - The Treynor Ratio – Internal is very similar to the regular Treynor Ratio. It is a measure of risk-adjusted return (similar to Sharpe Ratio). It divides excess return by risk. Excess return is defined as the annualized differences of the manager and the risk free rate. Risk is defined by beta. A high value for the Treynor Ratio is generally considered to be positive since either the excess return is rather large or the level of risk is low.
The primary difference between Treynor Ratio and Treynor Ratio – Internal is that the regular Treynor Ratio uses the annualized return of the manager and the annualized return of the risk free rate in the numerator. The Treynor Ratio – Internal first finds the differences between the manager and risk free rate for each month (or quarter) and then annualizes those differences. The two methods are generally result in very similar values, but differences can and do appear.
The formula for Treynor Ratio – Internal is:
![]()
Where:
![]() is
the product operator
is
the product operator
![]() represents
the monthly (or quarterly) returns of the manager
represents
the monthly (or quarterly) returns of the manager
![]() represents
the monthly (or quarterly) returns of the risk free rate
represents
the monthly (or quarterly) returns of the risk free rate
![]() is
the beta of the manager
is
the beta of the manager
![]() is
the number of years used in the selected timeframe
is
the number of years used in the selected timeframe
Upside Market Capture Ratio – (default in the system) The Up Market Capture Ratio measures the manager’s performance in up markets relative to the performance of the market (index) itself. An up market is defined as any period (month or quarter) where the market’s return is greater than or equal to zero.
The higher the Up Market Capture Ratio, the better the manager grew capital during a market expansion. A value of 110 suggests that a manager’s gain was 110% of the market’s gain when the market was up.
Note: the magnitude of the ratio may be deceiving if the nominal numbers are small. For example, an Up Market Capture Ratio of 300 indicates that the manager gained 300% of the index’s increase during a down market. However, if the manager’s return was 0.3% and the market’s return was 0.1% the ratio is 300, but the actual difference is trivial.
The formula for Up Market Capture Ratio is:
![]()
Where:
UMCR is the Up Market Capture Ratio
![]() is
the return of the manager in an up market
is
the return of the manager in an up market
![]() is
the return of the index in an up market
is
the return of the index in an up market
Upside Market Capture Return – (default in the system) The Up Market Capture Return is the return of the manager during an up market. An up market is defined as any period (month or quarter) where the market’s (index’s) return is greater than or equal to zero.
The Up Market Capture Return is the numerator in the Up Market Capture Ratio.
Upside Potential and Downside Risk - A measurement that separates standard deviation into upside uncertainty and downside risk. Instead of having only one risk factor, managers can dissect the variability of returns into uncertainty (upside) and risk (downside). Downside theory states that managers should be evaluated only in terms of their downside risk. On the other hand, upside uncertainty may reward managers because of positive returns and should not be considered when discussing risk.
Upside Probability – Upside Probability is the percentage of the time that the manager’s returns exceed the target return (either a static number or an index value). The target return may also be called the minimum acceptable return (MAR). A high Upside Probability suggests that the manager frequently beats the target.
The formula for Upside Probability is:
![]()
Upside Market Index Capture Return - The Up Market Index Capture Return is very similar to the Up Market Capture Return. The main difference is that this statistic measures the annualized return of the index in an up market. An up market is defined as any period (month or quarter) where the index is in positive territory.
Upside Uncertainty – Conversely used to verify all downside risk results. However, show the importance of upside probability.
Worst Four Quarters Return – Within a selected date range (For example: 5 years time period), the manager’s worst rate of return for every consecutive four quarters. The four consecutive quarters do not necessarily correspond with calendar years.
Worst Quarter – is defined as the worst single quarterly return reported by a manager during the specified time period. While a single quarter is a very brief period to evaluate, this measure of extremes may be used to gauge risk, especially against similar managers or the market.
Multi Statistics for 3, 4, 5, 6, 7, 8, 9 & 10 years– Shows returns by one of the selected periods for each of the following statistics:
Rate of Return
Standard Deviation
Sharpe Ratio Sample
Alpha
Beta
R-Squared
Relative Risk
Tracking Error
Treynor Ratio
Information Ratio
PSN M-Class Indices: PSN M-Class Indices are derived using median performance results and include separate accounts, as opposed to mutual funds, hedge funds, REIT, etc. A product must have at least one-year track record. Products must meet the PSN database registration and reporting requirement for inclusion into any index. To protect against survivor bias, all active, inactive, and terminated products are included. All index performance results are calculated using representative composite performance numbers provided by the investment management companies. Members in each index are derived using a qualified universe crafted by PSN. Each index is calculated on a quarterly basis. Returns prior to 12/31/2001 were back-filled to create historical performance results using data provided as of 2/15/02. Each quarter thereafter, the performance return is calculated six weeks after quarter end. Index inception date is constrained by a minimum of 50 qualified products. The list of members in each index may be modified on a quarterly basis to reflect new entrants and products that no longer meet the requirements.
PSN E-Class Indices: PSN E-Class Indices are derived using equal weighted performance results and include separate accounts, as opposed to mutual funds, hedge funds, REIT, etc. A product must have at least one-year track record. Products must meet the PSN database registration and reporting requirement for inclusion into any index. To protect against survivor bias, all active, inactive, and terminated products are included. All index performance results are calculated using representative composite performance numbers provided by the investment management companies. Members in each index are derived using a qualified universe crafted by PSN. Each index is calculated on a quarterly basis. Returns prior to 12/31/2001 were back-filled to create historical performance results using data provided as of 2/15/02. Each quarter thereafter, the performance return is calculated six weeks after quarter end. Index inception date is constrained by a minimum of 50 qualified products. The list of members in each index may be modified on a quarterly basis to reflect new entrants and products that no longer meet the requirements.
Accounts Gained and Lost - Shows the number and dollar value for all accounts gained or lost and provides total assets under management for the firm at each year-end.
Adjustable Rate Mortgage Pools - Emphasis on mortgage-backed securities in which the coupon will vary depending on the interest rates in the economy.
ADV Part 1 - Form ADV Part I contains information about an adviser's business, the persons who own or control the adviser, and whether the adviser or certain of its personnel have been sanctioned for violating the securities or other laws. The primary purpose of Part 1 is to provide information to regulators.
ADV Part II – Form ADV Part II is a written disclosure statement that provides information about business practices, fee and conflicts of interest the adviser may have with its clients. The primary purpose of Part II is for adviser to provide information to clients and potential clients. An adviser is not required to file with the Commission a copy of Part II of Form ADV if a copy of Part II (and any brochure deliver to clients) is the adviser’s files. The copy maintained in the adviser’s files is considered filed with the Commission.
Arbitrage/Hedging - Use of futures and derivative fixed income securities to take advantage of valuation differences in separate fixed-income markets. Generally involves securities with similar characteristics and strategies where attempts are being made to neutralize any short-term change in interest rates or shifts in the shape of the yield curve. It may also be used to commit to a particular interest rate forecast using long positions and financial futures.
Allocation by Market Value - Emphasis on market capitalization of securities as prime determinant of asset allocation.
Allocation Objective - Indicates allocation objective between Equity, Fixed Income, Cash and Other.
American Depository Receipts - Emphasis on receipts to foreign holdings in U.S. denomination.
Arbitrage - Equity Based: Use of long positions and derivatives to take advantage of price differences in separate markets, i.e., NYSE versus futures market. Often used with companies involved in friendly or unfriendly mergers or acquisitions. Fixed Income Based: Use of futures and derivative fixed income securities to take advantage of evaluation differences in separate fixed-income markets. Generally involves securities with similar characteristics and strategies where attempts are being made to neutralize any short-term change in interest rates or shifts in the shape of the yield curve. It may also be used to commit to a particular interest rate forecast using long positions and financial futures.
Asset Allocation and Market Timing - Emphasis on the allocation of assets in cash reserves or fixed-income securities as a substitute for common stocks to preserve principal. The manager who emphasizes market timing and asset allocation is generally willing to build substantial cash reserve positions (over 35%) in anticipation of a down market.
Assets and Fees Total - A snapshot that summarizes information based on the subscriber questionnaire distributed to PSN users. Information may include: the number of portfolio managers for all equity products or the average number of fixed-income accounts for the last four years.
Asset-Backed Securities - Emphasis on fixed-income securities backed by assets including car receivables (cars), credit card receivables (cards), or other securitized fixed income instruments. Typically, securities are intermediate/short duration and are less liquid, but offer a yield spread advantage over government and Treasury offerings.
Assets Under Management - The number of accounts and the dollar value of assets at the most recent year-end. These numbers are for the entire firm, but do not include International or Real Estate. Assets are broken down by account sizes in both the tax-exempt and taxable categories.
Bottom-Up Stock Selection - Emphasis primarily on individual stock selection. Considerations of economic and industry factors are of secondary importance in the investment decision-making process.
Business Cycle Analysis - Utilization of leading and lagging interest rate indicators to chart the economy and money market liquidity in an attempt to predict recessions, inflationary periods, depressions, and recovery periods for purposes or forecasting interest rates and sector trends.
Client Tailored Ranges - Investment mixes, i.e., the range for stocks, bonds and cash reserves is tailored to meet client objectives.
Collaterized Mortgage Pools - Emphasis on a mortgage security with different tranches or maturity classes that are a combination of many mortgage-backed pools.
Commingled Fund - A collective investment of assets from a number of participants whose funds are managed as one portfolio.
Computer Screening/Models - 1) Emphasis on the selection of individual securities utilizing screens and a computerized securities/research database. 2) Emphasis on utilization of domestic and foreign exchange models, interest rate momentum models and other quantitative methodologies and databases to forecast interest rates.
Contrarian - Favors stocks that are out-of-favor and are often turn-around candidates that are selling at or below traditional prices. Earnings are generally in a downward trend and the companies lack market sponsorship.
Convertibles - Equity Based: Purchased as surrogates for equities by managers who are defensive, emphasize income and prefer lower portfolio volatility. Fixed Income Based: Purchased as surrogates for conventional bonds by managers who attempt to enhance portfolio performance with some degree of equity feature exposure.
Core-Diversified Equity - Portfolio constructed around a "Core" holding of diversified equities.
Core Fixed Income - A fixed income approach that applies 90% or more of the securities available in the Barclays Capital Aggregate Index. MBS issues should be the major component of the portfolio in a core product.
Core Plus Fixed Income - A fixed income approach that applies more than 10% of the securities not included in the Barclays Capital Aggregate Index. In core plus products the portfolio replaces CMOs and/or private label and structured mortgage products instead of the normal amount of MBS issues.
Corporate Bonds - Corporate Bonds with ratings of at least BAA by Moody's or BBB by S&P's. Index: Barclays Capital Corporate Bond Index.
Corporates - More reliance upon industrials, finance companies, utilities and other non-government/agency bond issues to enhance returns. Exposure may vary from time to time depending upon yield spread relationships between corporates and government/agencies.
Country/Regional - Emphasis is on a country or geographic region such as continental Europe, the Pacific Basin or Japan
Covered Option Writing - Generation of income through writing call and/or put options against portfolio stock holdings.
Credit Analysis - Fixed-income securities are analyzed to anticipate changes in credit ratings. Managers who emphasize lower quality credits often focus on in-depth credit and earnings trends analysis to avoid downgrades, bankruptcies and reorganizations. Other managers focus their attention on attempting to identify potential credit/quality upgrade candidates.
CTA/Derivatives - Emphasis on synthetic portfolio construction and use of equity derivatives.
Currency Hedging - Either before or after security selection, a portfolio manager decides to make a meaningful currency selection decision by overweighting or underweighting specific countries. In some cases, currency hedging is used when a stock or sector is attractive, but currency is a concern.
Currency Overlay - Utilizes an investment program which coordinates and maximizes currency management by meeting clients' return and risk objectives to add value to foreign portfolios managed internally and/or by other managers.
Currency Selection - Research and analysis of historical and prospective foreign exchange and currency issues.
Current Income/Yield to Maturity - Emphasis on current yield.
Customized Policy - Allocation determined by a custom policy of asset classes and market sectors.
Dedication/Immunization - Emphasis on strategies that attempt to structure portfolios by duration or maturity to match an expected liability stream or investment horizon.
Distribution - Distribution shows the date range for information displayed on this graph.
Duration/Maturity Controlled - Fixed income strategies which focus on controlling the maturity and/or duration of the portfolio benchmarked to either a fixed income market index or to a selected maturity range. Other approaches simply restrict maturities to a specific range such as 1-3 year maturities.
Duration Overlay - Utilization of duration strategy to reduce portfolio volatility.
Earnings Surprise - Emphasis on securities that may experience an unexpected rise in earnings.
Equity Fundamental Characteristics - A snapshot of a representative portfolio or a firm's overall policy that compares dividend yield, earnings growth, leverage/debt, market capitalization, price/book ratio, and price/earnings ratio to the S&P 500. These are labeled E, G or L for Equal to, Greater than or Less than, respectively.
Equity Investment Guidelines/Policy Maximums- Indicates the maximum percent for each category base on the fund’s investment guidelines.
Equity Market Capitalization - Market capitalization is described in terms of standard ranges that run throughout portfolios managed in this particular investment style. PSN defines defining micro cap as under $500 Million; small cap as $500 Million to $2 Billion; medium cap as $2 Billion to $7 Billion. Each capitalization is then ranked on a 1-5 scale, which represents a percentage of those firm holdings in small, medium, or large cap, 1 being the highest percentage and 5 indicating no holdings at all. For example, PaineWebber may rank small cap a 3, meaning that 30-60% of their holdings are in small capitalization companies. If there is no dominant capitalization then the "All Capitalization" category would most likely be ranked 1 or 2; the other capitalization categories should be ranked 3, 4 or 5 depending upon their emphasis.
Equity Sell Discipline - Provides one of the following that bests suits the product: down from cost, up from cost, valuation level, target price, fundamental deterioration overview or opportunity costs.
ETI/Socially Responsible - Portfolio construction dictated by environmental or socio-political considerations.
Fixed Income Averages - Indicates average maturity, duration, quality and yield to maturity and coupon based on Moody’s or Standard & Poor’s quality ratings.
Fixed Income Derivative - Portfolio utilization of fixed-income derivatives and synthetic construction.
Fixed Income Maturities - Maturities are described in terms of standard ranges, which run throughout portfolios managed in this particular investment style. Investors may utilize all maturities in which case "All Maturities" should be ranked 1 and other maturities should be ranked 3, 4 or 5. Core bond managers should rank "intermediate" and "long" 1 or 2 with other maturity descriptions 3, 4 or 5.
Fixed Rate Mortgage Pools - Emphasis on mortgage backed securities with a constant coupon rate.
Floating Rate - Emphasis on fixed income securities with floating interest rate coupons.
Foreign - Emphasis on securities issued by a company which is incorporated outside the U.S. and generates a major portion of its business outside the U.S. or securities issued by governments other than the U.S. government.
Foreign Exchange Forecasting - Emphasis on the use of country by country macro-economic analysis and fundamental research on currency exchange trends and relative valuation analysis to forecast foreign exchange rates. May emphasize search for stable currencies or economics in a recovery stage where currencies are expected to strengthen.
Fund of Funds - An investment fund, which utilizes multiple managers.
Fundamental Analysis - Analysis based on financial ratios such as earnings per share and dividend yield.
Fundamental Characteristics - A snapshot of a representative portfolio or a firm's overall policy that compares dividend yield, earnings growth, leverage/debt, market capitalization, price/book ratio, and price/earnings ratio to the S&P 500. These are labeled E, G or L for Equal to, Greater than or Less than, respectively.
Future Earnings Growth - Emphasis on securities that are expected to attain consistently higher earnings multiples.
Futures/Options - 1) Capability and willingness to utilize derivatives to modify risk and return characteristics of equity portfolios using options and futures strategies such as over writing and covered call writing. 2) Utilization of derivatives including financial futures and options contracts to change the duration or characteristics of a fixed income portfolio.
GARP - Growth at Reasonable Price puts emphasis on long term ownership of securities with the ability to achieve an above-average growth rate. These securities are purchased at what is deemed a reasonable price.
Geographic Concentration Ranges - An estimation of the future policy ranges for each country based upon policies over the past three years.
Government/Agencies - Emphasis on government-backed securities including agency issues and mortgage-backed securities guaranteed by federal agencies.
Growth - Emphasis on stocks that have a relatively high return on equity and/or above-average earnings growth. Price/earnings ratios tend to be greater than the market and dividend yields tend to be less than the S&P 500 on a capitalization weighted basis.
Hedged Equity - Portfolio utilization of equity derivatives to reduce volatility and "hedge" against market decline.
Hedged Fixed Income - Portfolio utilization of fixed-income derivatives to reduce volatility and "hedge" against market decline.
High Income - Emphasis on stocks that generate high dividend yields and lower than average price/earnings multiples. May also include utilization of convertible securities and other equity surrogates that have higher than average income and lower than average price volatility.
Hybrid - Hybrids allow users to mix a set of managers and indexes with a certain weight allocated to each. The resulting combination behaves like a product and allows you to track its performance.
Index-Enhanced - 1) Attempts to replicate sector weightings on a market capitalization basis, but utilizes computer screens and models to "enhance" stock selection through a particular emphasis on market sectors or individual issues. Generally involves heavy utilization of quantitative models and little active decision-making by a portfolio manager. 2) Fixed-income portfolios may be constructed to replicate a specific fixed-income index and enhanced through semi-active portfolio management. Portfolios are typically managed utilizing quantitative models. Hedging and slight maturity and sector shifts are utilized to generate overall returns in an attempt to exceed the selected index or benchmark.
Index-Passive - Attempts to replicate the investment results of a selected market index or benchmark with no attempt to exceed index results.
Industry/Sector Analysis - Research focus on industry trends by economic grouping and where the manager is willing to modify the weightings among various industries in a fashion which is different from the S&P 500 Index.
Interest Rate Forecasting - Emphasis on forecasting future interest rates based upon technical, macro-economic forecasting methods. Portfolios are generally very liquid and focus almost exclusively on government and agency issues. Typically includes significant changes in the duration and/or average maturity in anticipation of higher or lower interest rates.
Interest Rate Movement - Emphasis on tracking interest rate momentum, changes in the shape of the yield curve and other historical research to structure fixed income portfolios. No attempt is made to forecast rates. The emphasis is on historical trends and momentum.
Key Portfolio Manager Tenure - (I) Year the portfolio manager has started managing this product, and (II) year the portfolio manager started in the investment industry. If there is a team, the longest period that one of the portfolio managers has been managing money for the product and in the industry.
Legal and Insurance Information - Shows ADV Filing status, previous legal judgments or pending litigation. Also indicates if the firm provides surety bond against fraudulent loss or theft, and professional insurance maintained by the firm.
Low Price to Earnings - Emphasis on securities with a lower than market price to earnings multiples.
Low Price to Book Value - Emphasis on securities with a lower than market price to book multiples.
Low Price to Cash Flow - Emphasis on securities with a lower than market price to cash flow multiple.
Lower Quality/High Yield - Emphasis on purchasing below investment grade (BAA) securities which tend to have higher leverage and lower earnings/interest rate coverage. Purchases of individual securities are often based upon yield spread advantages over similar maturity government/agency issues.
Managers and Products - Managers are money managing firms while the products are the types of portfolios that these firms handle.
Market Neutral - Emphasis on employing perfectly hedged strategies both in short and long positions.
Market Oriented/Flexible - Stocks tend to be eclectic, actively managed with relatively high portfolio turnover and no common themes or fundamental characteristics. Individual stocks are selected based upon surprise earnings, positive trends or other events, which are expected to trigger significant stock price increases.
Market Value - Emphasis on market capitalization of securities as prime determinant of asset allocation.
Maturity, Quality And Sector Distributions- The Maturity, Quality, and Sector Distribution sections are year-end figures using a representative portfolio or overall policy guidelines. Each year totals 100%. The Maturity Distribution section includes the high, low and average distribution.
Momentum - Emphasis on equities with significant acceleration in earnings growth.
Money Market - Use of short-term notes and commercial paper to enhance cash management efficiency.
Mortgage-Backed - Emphasis on heavy utilization of fixed-income securities including both conventional and government-backed mortgages. Can include mortgage derivatives such as principal-only or interest-only tranches.
Municipals - Maintains a research staff and portfolio managers who are capable of evaluating and managing portfolios for high-net-worth individuals or will purchase tax-exempt municipal bonds on an opportunistic basis when yield spreads are advantageous relative to governments and agencies.
Mutual Fund - An investment by which the investment company sells shares to acquire funds to invest in diversified assets.
Narrative Profiles - This is available for both U.S. and Global Manager Base. Each manager is requested to draft a profile, which includes background information on ownership, product offerings, services, and biographies on key investment professionals, as well as the marketing contact. Each narrative includes a page on investment philosophy, decision-making process, portfolio construction and fees for each investment product.
As a result, a PSN subscriber can review detailed information on all products and services offered by one manager or a series of products offered by multiple managers. Narrative profiles contain qualitative information about each PSN firm and its products. These narrative profiles allow PSN subscribers a chance to describe their services, in detail, from a manager's viewpoint. Each narrative profile is organized to follow a predefined PSN format.
Personnel - A number indicating the total personnel for each category. These numbers are year-end numbers from the previous year. They include all personnel who work on fixed income, not just personnel related to this product.
Performance Compliance - Indicates if performance numbers are in compliance with AIMR or IMCA and provide earliest date of compliant returns. If the numbers are in compliance with AIMR, a separate indicator provides the attestation Level I, Level II, or Level I & II. Also, the date the composite was verified, the name of the attestation firm, and a letter of attestation are part of the equity compliance information.
Performance Dispersion - Composite performance dispersion measures the consistency of a firm's composite performance results with respect to the individual portfolio returns within a composite. The AIMR-PPS standards require that managers disclose the dispersion of portfolio returns within each composite. PSN supplies the yearly high, median and low returns within your composite.
Performance Schedule - Indicates if the composite includes taxable or tax-exempt portfolios, and if it is fully discretionary. It also includes the following information:
v terminated accounts are included in the composite and the number of months the portfolio is managed before it is eligible for inclusion
v primary displayed returns are either pre-tax gross, pre-tax net, after-tax gross, or after-tax net of fees
v equal or dollar weighted
v returns are from a prior firm or simulated with simulation dates
v complete the performance schedule with performance numbers
v Percent in equity
v the number of accounts in the composite and the dollar amount in millions for each year-end
v performance benchmark/market index
v a brief (maximum 180 characters), clear footnote describing the nature of the composite
Portfolio Characteristics/Policy- Using a representative portfolio, users can find the low and high for BETA, R-Squared, the range of cash reserves and the number of securities held in a portfolio. They can also use it to look up the number of securities held in a portfolio, the range of cash reserves and the range of duration.
Portfolio Turnover - Portfolio Turnover refers to the rate of trading activity in a fund’s portfolio of investments, equal to the lesser of purchases or sales, for a year, divided by average total assets during that year.
Product Assets - Shows the number of accounts and the dollar value of assets at year-end for each product.
Product Fees - The annual fee is calculated in thousands for each fund size for the past five years. The minimum individual & commingled account size and the minimum individual & commingled annual fee are in thousands.
Professional Turnover and Personnel Summary- Provides a figure for each category of personnel; portfolio managers, research analysts, traders, and marketing specialists. The sum of these categories should equal the total number of professionals. Total professionals plus other staff should equal total employees. Total professionals must also equal Total Pros from the Professional Turnover section for the same year. The numbers should be the most recent year-end numbers.
PSN Ranking System - PSN allows its subscribers to quantify or rank their investment styles based on the meaningfulness of the selected style. For example, an equity manager may use earnings growth as one of the more important features within his/her product, and would rank this based on PSN's 1-5 ranking system; 1 Very Important, 2 Important, 3 Utilized, 4 Not Important, 5 Not Utilized.
Quantitative Research - Investment decisions derived from statistical and quantitative models that observe market behavior.
Registration Information - Indicates if the firm is a registered investment advisor, and the number of states it is registered in, along with the status of registration and number of clients in each state.
REIT - (Real Estate Investment Trust) A company that manages an investment portfolio of real estate to earn profits for shareholders.
Relative Price/Fundamental - Emphasizes stocks that may have price/earnings ratios higher than the overall market, but are selling at prices, which are deemed attractive relative to historical trading ranges. Companies may be purchased early in a business cycle or when less researched or are somewhat out-of-favor due to a recent earnings disappointment or a similar event.
Representative Client List - Provides a representative client list of clients for either the Global or Domestic Manager Base which also includes the client type and account type for each client based on the following:
Sector/Inter Market Swapping - Emphasis on analyzing yield spreads and bond valuation (prices, coupons, and credits) among different sectors or groupings of the bond market.
Sector Rotation - Emphasis on industries, which are expected to outperform the market and under-weights industries when they are expected to under-perform the market.
Sector/Spread Analysis - Research may be organized by security sector such as asset-backed, mortgage-backed, short-term, corporates, etc., to assist in the determination of yield and spreads to government and agency issues. Results focus less on interest rate movements or shape of the yield curve and focus more on yield spreads and sector valuations.
Security Weighting Methods - Equal Weighted: Emphasis on market capitalization of securities as prime determinant of asset allocation. Capitalization Weighted: Market capitalization of stocks determines weightings within portfolio.
Separate Account Composite - Representative compilation of accounts managed on an account by account basis subscribing to the same product style.
Short-Selling - Emphasis on location of overvalued stocks and selling such issues "short" in anticipation of price decline.
Special Situations/Sinkers - Emphasis on bottom-up fixed income security selection based upon reorganizations, credit upgrades, unusual spread relationships or other events. Also includes managers that specialize in sinking fund issues and other specialized fixed income instruments.
Stable Value/GIC - Invests in a contract or contracts issued by an insurance company or other entity, which guarantees the repayment of principal and a compound interest return.
Style Emphasis - PSN allows its subscribers to quantify or rank their investment styles based on the meaningfulness of the selected style. For example, an equity manager may rank earnings growth as one of the more important features within his/her product, and would rank this based on PSN's 1-5 ranking system; 1 Very Important, 2 Important, 3 Utilized, 4 Not Important, 5 Not Utilized.
Tactical Asset Allocation - Active management of the mix among various asset classes including common stocks, fixed income and cash equivalents. Emphasis is on timing these tactical or strategic decisions. Security selection is generally a secondary emphasis. In some cases, may utilize passive commingled funds for each asset class.
Technical Analysis - Analysis of trends in stock or commodity prices and patterns of price changes, including volume trading statistics and other variables.
Theme Identification - Emphasis on "themes" or "ideas" having to do with such concepts as dis-inflation, energy shortages, interest rates, new technologies, industry trends or changing consumption patterns.
Top-Down/Economic Analysis - Emphasis primarily on macroeconomic trends as opposed to bottom-up stock selection.
Value - Emphasis on fundamental value based strategies such as Graham-Dodd or similar intrinsic value approaches which favor strong balance sheets, low price/book ratios and market values perceived to be below the break up or private investment value of a company.
Venture Capital - Invests in capital, which is subject to more than a normal degree of risk, usually associated with a new business or venture.
Wrap Fee/Managed Account Program - A program under which any client is charged a specified fee or fees not based directly upon transactions in a client's account for investment advisory services (which may include portfolio management or advice concerning the selection of other investment advisers) and execution of client transactions.
Yield Curve Analysis - Observation of yield curve to exploit irregularities between areas of curve.
Zero Coupon - Zero Coupon emphasis or utilization of government or semi-government securities, which are stripped of interest payments or coupons. Such securities tend to be more volatile and are utilized for aggressive interest forecasting or to lock in a high degree of certainty of return over a specified period by avoiding reinvestment risk.
PSN Enterprise is a product offered by the Research Products and Services Division of Informa Investment Solutions. For more information about Informa Investment Solutions, please visit our website at www.informais.com.

Copyright 2005 © Reuters. All rights reserved. Any copying, republication or redistribution of Information, including by caching, framing or similar means, is expressly prohibited without the prior written consent of Lipper. Lipper shall not be liable for any errors or delays in the content, or for any actions taken in reliance thereon.

Copyright Ó 2005, Standard & Poor’s, a division of The McGraw-Hill Companies, Inc. Standard & Poor’s including its subsidiary corporations (“S&P”) is a division of The McGraw-Hill Companies, Inc. Reproduction of PSN Enterprise in any form is prohibited except with the prior written permission of S&P. Because of the possibility of human or mechanical error by S&P’s sources, S&P or others, S&P does not guarantee the accuracy, adequacy, completeness or availability of any information and is not responsible for any errors or omissions or for the results obtained from the use of such information. S&P GIVES NO EXPRESS OR IMPLIED WARRANTIES, INCLUDING, BUT NOT LIMITED TO, ANY WARRANTIES OF MERCHANTABILITY OR FITNESS FOR A PARTICULAR PURPOSE OR USE. In no event shall S&P be liable for any indirect, special or consequential damages in connection with subscriber’s or others’ use of PSN Enterprise.
![]()
Copyright Ó 2007 Morningstar, Inc. All Rights reserved. The information contain herein: (1) is proprietary to Morningstar and/or its content providers; (2) may not be copied or distributed; and (3) is not warranted to be accurate, complete or timely. Neither Morningstar nor its content providers are responsible for any damages or losses arising from any use of this information. Past performance is not guarantee of future results.
Copyright © 2005 Informa Investment Solutions, Inc., www.informais.com
This is the Online Help System. Distribution and Usage of this user guide is limited to client of PSN Enterprise only. Reproduction of any information obtained from this user guide in any form is prohibited except with the written permission of Informa Investment Solutions, Inc.
PSN Enterprise is a product of Informa Investment Solutions, Inc. PSN is an investment manager database and is a division of Informa Investment Solutions, Inc. Reproduction of any information obtained from PSN in any form is prohibited except with the written permission of Informa Investment Solutions, Inc.
Past performance does not guarantee future results. Gross of fees performance figures do not take into account advisory fees or transaction costs. These fees and costs will reduce actual returns. The information provided is not intended to be a complete analysis of every material fact concerning separate account products. The performance figures have been reported solely for informational purposes and have been provided by the separate account managers. No representation is given with respect to their accuracy or completeness, nor that the figures are necessarily AIMR compliant, and they will be subject to change. This information should not be deemed an offer to sell or a solicitation of an offer to buy shares of any products that are described herein. Index performance returns do not reflect any management fees, transaction costs or expenses. One cannot invest directly in an index.
Because of the possibility of human or mechanical error by Informa Investment Solutions sources or others, Informa Investment Solutions does not guarantee the accuracy, adequacy, completeness or availability of any information and is not responsible for any errors or omissions or for the results obtained from the use of such information. THERE ARE NO EXPRESS OR IMPLIED WARRANTIES, INCLUDING, BUT NOT LIMITED TO, WARRANTIES OF MERCHANTABILITY OR FITNESS FOR A PARTICULAR PURPOSE OR USE. In no event shall Informa Investment Solutions be liable for any indirect, special or consequential damages in connection with use of any subset of PSN data or derived data.